SlideShare a Scribd company logo
1 of 4
Page 1 of 4
Faculty: AMIR KHATRI
1. Dispersion
a. summarize the data into a single value.
b. measures the concentration of a set of observations.
c. Measures the scatterness of a set of observations.
d. None of these
2. Which measure of dispersion is based on all observations?
a. range b. quartile deviation
c. mean deviation d. all of these
3. which measure of dispersion is not affected by extreme observations?
a. range b. quartile deviation
c. mean deviation d. all of these
4. The appropriate measure of dispersion for open end classification is:
a. range b. quartile deviation
c. mean deviation d. all of these
5. which of the following is a positional measure?
a. M.D b. Q.D c. S.D d. C.V
6. Which measure of dispersion is based on the absolute deviations only?
a. M.D b. Q.D c. S.D d. Range
7. Mean deviation from ‘A’ is minimum if A =
a. mean b. mode
c. median d. none of these
8. If the marks scored by all 10 students are the same as 45, the standard deviation of
marks for the 10 students is
a. 45 b. 0
c. 10 d. none of these
9. When the variability of two series is to be compared, which of the following should be
used?
a. absolute measure of average b. absolute measure of dispersion
c. relative measure of dispersion d. relative measure of average
10. For two numbers S.D is always
a. half the range b. double the range
c. square the range d. equal to range
11. Which of the following measure is independent of unit of measurement?
a. S.D b. coefficient of variation
c. range d. Q.D
Page 2 of 4
Faculty: AMIR KHATRI
12. If each & every observations are decreased by 2 then M.D of new observation
a. decreases by 2 b. remains same
c. increases by 2 d. none of these
13. If all the observations are multipliedby 3,
a. C.V is also three times the previous C.V
b. S.D remains unchanged
c. C.V remains unchanged
d. none of these
14. If x &y are related by y = 3x + 4 & M.D from median & median of x is 3 & 16 respectively,
then find the coefficient of M.D from median for y is
a. 0.19 b. 0.25 c. 0.058 d. 0.17
15. The variance of a set of data is 9. If every item is doubled then what will be the variance
of the resulting data set?
a. 9 b. 36 c. 18 d. 4.5
16. The coefficient of mean deviation of first five natural numbers is
a. 0.3 b. 0.4 c. 0.5 d. 0.7
17. Which empirical relation is correct for symmetric distribution?
a. M.D =
3
4
S.D b. M.D =
4
5
S.D
c. M.D =
4
3
S.D d. M.D =
5
4
S.D
18. Q.D is …….. of S.D in a symmetric distribution.
a. 1/3 b. 2/3 c. 1/4 d. ¾
19. The following information is available on two group I & II. Find combined standard
deviation.
Group I n1 = 10, 𝑥̅1 = 28, S1
= 35
Group II n2 = 20, 𝑥̅2 = 24, S2
= 35
a. 1228.50 b. 35.50 c. 1822.05 d. 35.05
20. Sum of 20 observations is 420 & the sum of the positive deviations taken from mean is
180. Then find coefficient of deviation
a.
3
7
b.
60
7
c. 9 d. 21
21. ∑( 𝑥 − 20) = 0, ∑( 𝑥 − 20)2 = 400𝑛. Find C.V
a. 0 b. 100 c. 20 d. 2000
Page 3 of 4
Faculty: AMIR KHATRI
22. Mean & S.D of 10 observations are 80 & 4 respectively. Find the sum of squares of
observations.
a. 64160 b. 680 c. 46.4 d. none of
these
23. Find mean deviation from median for 5, 5, 5, 5, 5, 5.
a. 0 b. 5 c. 1 d. none of these
24. The M.D of 1, 2, 3, 4, 5, 6, 7, hence M.D of 2.7, 4.7, 6.7, 8.7, 10.7, 12.7, 14.7 is
a. 3.42 b. 1.78 c. 3.49 d. none of
these
25. A shift of scale has no impact on
a. Range b. Q.D c. S.D d. C.V
26. If every item in a series is increased by the same quantity, the quartile deviation
a. increases by the same quantity
b. decreases by the same quantity
c. remain same
d. increases by the square of that quantity
27. If the S.D of x is 3.5, what is the variance of (10 – 2x)?
a. 49 b. 3 c. -14.5 d. 51
28. If all the observations in a data is increased by the same quantity then which of the
following is true?
a. range decreasesby same quantity
b. standard deviation remains unchanged
c. coefficient of variations increases
d. both (b) & (c)
29. If x & y are related by 2y = 3x +10, then
a. 2Ry = Rx b. 2Ry = 3Rx + 10
c. 2Ry = 3Rx d. Ry = 3Rx
30. If each observation of a raw data whose variance is k is multiplied by m, then variance
of the new set is:
a. k2
m2
b. km2
c. km d. √ 𝑘 𝑚
31. The quartile deviation of a variable y is Q. the quartile deviation of the variable
𝑎1 𝑦+ 𝑎2
𝑎3
is
a. |
𝑎1
𝑎3
|Q b. | 𝑎1|Q
c.
𝑎1 𝑄+ 𝑎2
𝑎3
d. none of these
32. If 2 C.V = 7 𝑥̅ & 2S.D = 7 𝑥̅. Find 𝑥̅.
a. 100 b. 1 c. 3.5 d. none of
these
Page 4 of 4
Faculty: AMIR KHATRI
33. Mean & variance of 10 observations are 15 & 4. If one observation was taken as 12
instead of 21. Find correct 𝑥̅ & S.D.
a. 15, 4.23 b. 15.9, 4
c. 15.9, 4.23 d. none of these
34. For the data given below obtain combined S.D.
A
𝑥̅ = 35, ∑ 𝑥 = 875,
S1 = 1
B
n = 25, 𝑥̅ = 45, ∑ 𝑥2
= 50725
a. 2.45 b. 5.24 c. 5.42 d. 4.25
35. Sum & difference between the two extreme qaurtiles is 298 & 18 respectively. Compute
coefficient of quartile deviation.
a. 0.06 b. 16.56 c. 9 d. 149
36. The deviation taken from mean are -12, -6, 0, 8, 10. Calculate mean deviation from
mean.
a. 68.8 b. 0 c. 7.2 d. 8.29
37. Quartile deviation of 1, 2, 3, 4, 5, 6, 7 is 2 hence find the quartile deviation of 6.6, 9.6,
12.6, 15.6, 18.6, 21.6, 24.6.
a. 6 b. 3.2 c. 7.2 d. 9.6
38. For a data having two observations, standard deviation is 4. Then range is
a. 8 b. 2 c. 1 d. none of these
39. For two data sets, number of obsewrvations & means are equal to 50. If combined
standard deviation is 5 then whichj of the following is true?
a. S1 + S2 = 5 b. S1 + S2 = 50
c. 𝑆1
2
+ 𝑆2
2
= 50 d. 𝑆1
2
+ 𝑆2
2
= 5
40. If sum, sum of deviations & sum of squares of deviations from mean for 10 observations
is 590, 216 & 6488 respectively, then coeffucient of mean deviation is
a. 0.37 b. 11 c. 3 d. 21.6

More Related Content

What's hot

Mcqs (introduction of statistics)
Mcqs (introduction of statistics)Mcqs (introduction of statistics)
Mcqs (introduction of statistics)Nadeem Uddin
 
Mcqs (regression and correlation)
Mcqs (regression and correlation)Mcqs (regression and correlation)
Mcqs (regression and correlation)Nadeem Uddin
 
The standard normal curve & its application in biomedical sciences
The standard normal curve & its application in biomedical sciencesThe standard normal curve & its application in biomedical sciences
The standard normal curve & its application in biomedical sciencesAbhi Manu
 
Multiple Choice Questions - Biostatistics
Multiple Choice Questions - BiostatisticsMultiple Choice Questions - Biostatistics
Multiple Choice Questions - BiostatisticsRaman Dhungel
 
The Normal distribution
The Normal distributionThe Normal distribution
The Normal distributionSarfraz Ahmad
 
Biostatistics exam questions by tadele girum
Biostatistics exam questions  by tadele girumBiostatistics exam questions  by tadele girum
Biostatistics exam questions by tadele girumTadele Girum
 
Standardization of rates by Dr. Basil Tumaini
Standardization of rates by Dr. Basil TumainiStandardization of rates by Dr. Basil Tumaini
Standardization of rates by Dr. Basil TumainiBasil Tumaini
 
Unit-I Measures of Dispersion- Biostatistics - Ravinandan A P.pdf
Unit-I Measures of Dispersion- Biostatistics - Ravinandan A P.pdfUnit-I Measures of Dispersion- Biostatistics - Ravinandan A P.pdf
Unit-I Measures of Dispersion- Biostatistics - Ravinandan A P.pdfRavinandan A P
 
Mcqs (testing of hypothesis)
Mcqs (testing of hypothesis)Mcqs (testing of hypothesis)
Mcqs (testing of hypothesis)Nadeem Uddin
 
One sided or one-tailed tests
One sided or one-tailed testsOne sided or one-tailed tests
One sided or one-tailed testsHasnain Baber
 
Nursing research quiz series
Nursing research quiz seriesNursing research quiz series
Nursing research quiz seriesNursing Path
 
Hypothesis Test Bank with Solutions
Hypothesis Test Bank with SolutionsHypothesis Test Bank with Solutions
Hypothesis Test Bank with SolutionsBody of Knowledge
 
Standard Error of Proportion & Two Proportions
Standard Error of Proportion & Two ProportionsStandard Error of Proportion & Two Proportions
Standard Error of Proportion & Two ProportionsJagdish Powar
 

What's hot (20)

Mcqs (introduction of statistics)
Mcqs (introduction of statistics)Mcqs (introduction of statistics)
Mcqs (introduction of statistics)
 
Descriptive Statistics
Descriptive StatisticsDescriptive Statistics
Descriptive Statistics
 
Mcqs (regression and correlation)
Mcqs (regression and correlation)Mcqs (regression and correlation)
Mcqs (regression and correlation)
 
5 regression
5 regression5 regression
5 regression
 
Bio state kmu
Bio state kmuBio state kmu
Bio state kmu
 
The standard normal curve & its application in biomedical sciences
The standard normal curve & its application in biomedical sciencesThe standard normal curve & its application in biomedical sciences
The standard normal curve & its application in biomedical sciences
 
Multiple Choice Questions - Biostatistics
Multiple Choice Questions - BiostatisticsMultiple Choice Questions - Biostatistics
Multiple Choice Questions - Biostatistics
 
The Normal distribution
The Normal distributionThe Normal distribution
The Normal distribution
 
Biostatistics exam questions by tadele girum
Biostatistics exam questions  by tadele girumBiostatistics exam questions  by tadele girum
Biostatistics exam questions by tadele girum
 
SAMPLING MCQ
SAMPLING  MCQSAMPLING  MCQ
SAMPLING MCQ
 
Standardization of rates by Dr. Basil Tumaini
Standardization of rates by Dr. Basil TumainiStandardization of rates by Dr. Basil Tumaini
Standardization of rates by Dr. Basil Tumaini
 
Unit-I Measures of Dispersion- Biostatistics - Ravinandan A P.pdf
Unit-I Measures of Dispersion- Biostatistics - Ravinandan A P.pdfUnit-I Measures of Dispersion- Biostatistics - Ravinandan A P.pdf
Unit-I Measures of Dispersion- Biostatistics - Ravinandan A P.pdf
 
Mcqs (testing of hypothesis)
Mcqs (testing of hypothesis)Mcqs (testing of hypothesis)
Mcqs (testing of hypothesis)
 
One sided or one-tailed tests
One sided or one-tailed testsOne sided or one-tailed tests
One sided or one-tailed tests
 
Nursing research quiz series
Nursing research quiz seriesNursing research quiz series
Nursing research quiz series
 
Normal distribution
Normal distributionNormal distribution
Normal distribution
 
Descriptive epidemiology
Descriptive epidemiologyDescriptive epidemiology
Descriptive epidemiology
 
Mod mean quartile
Mod mean quartileMod mean quartile
Mod mean quartile
 
Hypothesis Test Bank with Solutions
Hypothesis Test Bank with SolutionsHypothesis Test Bank with Solutions
Hypothesis Test Bank with Solutions
 
Standard Error of Proportion & Two Proportions
Standard Error of Proportion & Two ProportionsStandard Error of Proportion & Two Proportions
Standard Error of Proportion & Two Proportions
 

Similar to 3 measure of dispersion

GEN ED MATH 2 PNU[1].pptx
GEN ED MATH 2 PNU[1].pptxGEN ED MATH 2 PNU[1].pptx
GEN ED MATH 2 PNU[1].pptxAldineRaytan
 
Mcqs (measures of dispersion)
Mcqs (measures of dispersion)Mcqs (measures of dispersion)
Mcqs (measures of dispersion)Nadeem Uddin
 
Page 1 of 18Part A Multiple Choice (1–11)______1. Using.docx
Page 1 of 18Part A Multiple Choice (1–11)______1. Using.docxPage 1 of 18Part A Multiple Choice (1–11)______1. Using.docx
Page 1 of 18Part A Multiple Choice (1–11)______1. Using.docxalfred4lewis58146
 
Grade 10 Math - Second Quarter Summative Test
Grade 10 Math - Second Quarter Summative TestGrade 10 Math - Second Quarter Summative Test
Grade 10 Math - Second Quarter Summative Testrobengie monera
 
ag assign1.0.docx
ag assign1.0.docxag assign1.0.docx
ag assign1.0.docxEmieVelasco
 
Introduction to Probability and Statistics 13th Edition Mendenhall Solutions ...
Introduction to Probability and Statistics 13th Edition Mendenhall Solutions ...Introduction to Probability and Statistics 13th Edition Mendenhall Solutions ...
Introduction to Probability and Statistics 13th Edition Mendenhall Solutions ...MaxineBoyd
 
3.3 Measures of Variation
3.3 Measures of Variation3.3 Measures of Variation
3.3 Measures of Variationmlong24
 
1. fj What value of the constant c will make the following lim.docx
1. fj What value of the constant c will make the following lim.docx1. fj What value of the constant c will make the following lim.docx
1. fj What value of the constant c will make the following lim.docxjackiewalcutt
 
Maths questiion bank for engineering students
Maths questiion bank for engineering studentsMaths questiion bank for engineering students
Maths questiion bank for engineering studentsMrMRubanVelsUniversi
 
Upcat math 2014 original
Upcat math 2014 originalUpcat math 2014 original
Upcat math 2014 originalMark Garrido
 
Notes and formulae mathematics
Notes and formulae mathematicsNotes and formulae mathematics
Notes and formulae mathematicsZainonie Ma'arof
 
1 FACULTY OF SCIENCE AND ENGINEERING SCHOOL OF COMPUT.docx
1  FACULTY OF SCIENCE AND ENGINEERING SCHOOL OF COMPUT.docx1  FACULTY OF SCIENCE AND ENGINEERING SCHOOL OF COMPUT.docx
1 FACULTY OF SCIENCE AND ENGINEERING SCHOOL OF COMPUT.docxmercysuttle
 

Similar to 3 measure of dispersion (20)

4 correlation
4 correlation4 correlation
4 correlation
 
Math exercises
Math exercisesMath exercises
Math exercises
 
GEN ED MATH 2 PNU[1].pptx
GEN ED MATH 2 PNU[1].pptxGEN ED MATH 2 PNU[1].pptx
GEN ED MATH 2 PNU[1].pptx
 
Mcqs (measures of dispersion)
Mcqs (measures of dispersion)Mcqs (measures of dispersion)
Mcqs (measures of dispersion)
 
Page 1 of 18Part A Multiple Choice (1–11)______1. Using.docx
Page 1 of 18Part A Multiple Choice (1–11)______1. Using.docxPage 1 of 18Part A Multiple Choice (1–11)______1. Using.docx
Page 1 of 18Part A Multiple Choice (1–11)______1. Using.docx
 
Grade 10 Math - Second Quarter Summative Test
Grade 10 Math - Second Quarter Summative TestGrade 10 Math - Second Quarter Summative Test
Grade 10 Math - Second Quarter Summative Test
 
ag assign1.0.docx
ag assign1.0.docxag assign1.0.docx
ag assign1.0.docx
 
Introduction to Probability and Statistics 13th Edition Mendenhall Solutions ...
Introduction to Probability and Statistics 13th Edition Mendenhall Solutions ...Introduction to Probability and Statistics 13th Edition Mendenhall Solutions ...
Introduction to Probability and Statistics 13th Edition Mendenhall Solutions ...
 
Mock 2015
Mock 2015Mock 2015
Mock 2015
 
14. Statistics
14. Statistics14. Statistics
14. Statistics
 
3.3 Measures of Variation
3.3 Measures of Variation3.3 Measures of Variation
3.3 Measures of Variation
 
Stat answer-key
Stat answer-keyStat answer-key
Stat answer-key
 
1. fj What value of the constant c will make the following lim.docx
1. fj What value of the constant c will make the following lim.docx1. fj What value of the constant c will make the following lim.docx
1. fj What value of the constant c will make the following lim.docx
 
Maths questiion bank for engineering students
Maths questiion bank for engineering studentsMaths questiion bank for engineering students
Maths questiion bank for engineering students
 
Upcat math 2014 original
Upcat math 2014 originalUpcat math 2014 original
Upcat math 2014 original
 
Notes and formulae mathematics
Notes and formulae mathematicsNotes and formulae mathematics
Notes and formulae mathematics
 
Statistics
StatisticsStatistics
Statistics
 
Asenime mathematics
Asenime mathematicsAsenime mathematics
Asenime mathematics
 
Prac excises 3[1].5
Prac excises 3[1].5Prac excises 3[1].5
Prac excises 3[1].5
 
1 FACULTY OF SCIENCE AND ENGINEERING SCHOOL OF COMPUT.docx
1  FACULTY OF SCIENCE AND ENGINEERING SCHOOL OF COMPUT.docx1  FACULTY OF SCIENCE AND ENGINEERING SCHOOL OF COMPUT.docx
1 FACULTY OF SCIENCE AND ENGINEERING SCHOOL OF COMPUT.docx
 

More from Anas Farooq Maniya AFM (9)

Examination guidance july2015 "ICAP"
Examination guidance july2015 "ICAP"Examination guidance july2015 "ICAP"
Examination guidance july2015 "ICAP"
 
ECONOMICS TOPIC WISE 2
ECONOMICS TOPIC WISE 2ECONOMICS TOPIC WISE 2
ECONOMICS TOPIC WISE 2
 
ECONOMICS TOPIC WISE 1
ECONOMICS TOPIC WISE 1ECONOMICS TOPIC WISE 1
ECONOMICS TOPIC WISE 1
 
CAF-9 (Audit & Assurance)
CAF-9 (Audit & Assurance)CAF-9 (Audit & Assurance)
CAF-9 (Audit & Assurance)
 
CAF-2 (Intro to Economics & Finance)
CAF-2 (Intro to Economics & Finance)CAF-2 (Intro to Economics & Finance)
CAF-2 (Intro to Economics & Finance)
 
CAF-1 (Intro To Accounts)
CAF-1 (Intro To Accounts)CAF-1 (Intro To Accounts)
CAF-1 (Intro To Accounts)
 
Probability distribution
Probability distributionProbability distribution
Probability distribution
 
6 probability
6 probability6 probability
6 probability
 
First degree equation in one variable
First degree equation in one variableFirst degree equation in one variable
First degree equation in one variable
 

Recently uploaded

Influencing policy (training slides from Fast Track Impact)
Influencing policy (training slides from Fast Track Impact)Influencing policy (training slides from Fast Track Impact)
Influencing policy (training slides from Fast Track Impact)Mark Reed
 
ENG 5 Q4 WEEk 1 DAY 1 Restate sentences heard in one’s own words. Use appropr...
ENG 5 Q4 WEEk 1 DAY 1 Restate sentences heard in one’s own words. Use appropr...ENG 5 Q4 WEEk 1 DAY 1 Restate sentences heard in one’s own words. Use appropr...
ENG 5 Q4 WEEk 1 DAY 1 Restate sentences heard in one’s own words. Use appropr...JojoEDelaCruz
 
Student Profile Sample - We help schools to connect the data they have, with ...
Student Profile Sample - We help schools to connect the data they have, with ...Student Profile Sample - We help schools to connect the data they have, with ...
Student Profile Sample - We help schools to connect the data they have, with ...Seán Kennedy
 
ClimART Action | eTwinning Project
ClimART Action    |    eTwinning ProjectClimART Action    |    eTwinning Project
ClimART Action | eTwinning Projectjordimapav
 
ICS2208 Lecture6 Notes for SL spaces.pdf
ICS2208 Lecture6 Notes for SL spaces.pdfICS2208 Lecture6 Notes for SL spaces.pdf
ICS2208 Lecture6 Notes for SL spaces.pdfVanessa Camilleri
 
INTRODUCTION TO CATHOLIC CHRISTOLOGY.pptx
INTRODUCTION TO CATHOLIC CHRISTOLOGY.pptxINTRODUCTION TO CATHOLIC CHRISTOLOGY.pptx
INTRODUCTION TO CATHOLIC CHRISTOLOGY.pptxHumphrey A Beña
 
How to Add Barcode on PDF Report in Odoo 17
How to Add Barcode on PDF Report in Odoo 17How to Add Barcode on PDF Report in Odoo 17
How to Add Barcode on PDF Report in Odoo 17Celine George
 
4.16.24 Poverty and Precarity--Desmond.pptx
4.16.24 Poverty and Precarity--Desmond.pptx4.16.24 Poverty and Precarity--Desmond.pptx
4.16.24 Poverty and Precarity--Desmond.pptxmary850239
 
Inclusivity Essentials_ Creating Accessible Websites for Nonprofits .pdf
Inclusivity Essentials_ Creating Accessible Websites for Nonprofits .pdfInclusivity Essentials_ Creating Accessible Websites for Nonprofits .pdf
Inclusivity Essentials_ Creating Accessible Websites for Nonprofits .pdfTechSoup
 
Textual Evidence in Reading and Writing of SHS
Textual Evidence in Reading and Writing of SHSTextual Evidence in Reading and Writing of SHS
Textual Evidence in Reading and Writing of SHSMae Pangan
 
Integumentary System SMP B. Pharm Sem I.ppt
Integumentary System SMP B. Pharm Sem I.pptIntegumentary System SMP B. Pharm Sem I.ppt
Integumentary System SMP B. Pharm Sem I.pptshraddhaparab530
 
How to do quick user assign in kanban in Odoo 17 ERP
How to do quick user assign in kanban in Odoo 17 ERPHow to do quick user assign in kanban in Odoo 17 ERP
How to do quick user assign in kanban in Odoo 17 ERPCeline George
 
Presentation Activity 2. Unit 3 transv.pptx
Presentation Activity 2. Unit 3 transv.pptxPresentation Activity 2. Unit 3 transv.pptx
Presentation Activity 2. Unit 3 transv.pptxRosabel UA
 
TEACHER REFLECTION FORM (NEW SET........).docx
TEACHER REFLECTION FORM (NEW SET........).docxTEACHER REFLECTION FORM (NEW SET........).docx
TEACHER REFLECTION FORM (NEW SET........).docxruthvilladarez
 
HỌC TỐT TIẾNG ANH 11 THEO CHƯƠNG TRÌNH GLOBAL SUCCESS ĐÁP ÁN CHI TIẾT - CẢ NĂ...
HỌC TỐT TIẾNG ANH 11 THEO CHƯƠNG TRÌNH GLOBAL SUCCESS ĐÁP ÁN CHI TIẾT - CẢ NĂ...HỌC TỐT TIẾNG ANH 11 THEO CHƯƠNG TRÌNH GLOBAL SUCCESS ĐÁP ÁN CHI TIẾT - CẢ NĂ...
HỌC TỐT TIẾNG ANH 11 THEO CHƯƠNG TRÌNH GLOBAL SUCCESS ĐÁP ÁN CHI TIẾT - CẢ NĂ...Nguyen Thanh Tu Collection
 
Visit to a blind student's school🧑‍🦯🧑‍🦯(community medicine)
Visit to a blind student's school🧑‍🦯🧑‍🦯(community medicine)Visit to a blind student's school🧑‍🦯🧑‍🦯(community medicine)
Visit to a blind student's school🧑‍🦯🧑‍🦯(community medicine)lakshayb543
 

Recently uploaded (20)

Influencing policy (training slides from Fast Track Impact)
Influencing policy (training slides from Fast Track Impact)Influencing policy (training slides from Fast Track Impact)
Influencing policy (training slides from Fast Track Impact)
 
ENG 5 Q4 WEEk 1 DAY 1 Restate sentences heard in one’s own words. Use appropr...
ENG 5 Q4 WEEk 1 DAY 1 Restate sentences heard in one’s own words. Use appropr...ENG 5 Q4 WEEk 1 DAY 1 Restate sentences heard in one’s own words. Use appropr...
ENG 5 Q4 WEEk 1 DAY 1 Restate sentences heard in one’s own words. Use appropr...
 
Student Profile Sample - We help schools to connect the data they have, with ...
Student Profile Sample - We help schools to connect the data they have, with ...Student Profile Sample - We help schools to connect the data they have, with ...
Student Profile Sample - We help schools to connect the data they have, with ...
 
INCLUSIVE EDUCATION PRACTICES FOR TEACHERS AND TRAINERS.pptx
INCLUSIVE EDUCATION PRACTICES FOR TEACHERS AND TRAINERS.pptxINCLUSIVE EDUCATION PRACTICES FOR TEACHERS AND TRAINERS.pptx
INCLUSIVE EDUCATION PRACTICES FOR TEACHERS AND TRAINERS.pptx
 
ClimART Action | eTwinning Project
ClimART Action    |    eTwinning ProjectClimART Action    |    eTwinning Project
ClimART Action | eTwinning Project
 
ICS2208 Lecture6 Notes for SL spaces.pdf
ICS2208 Lecture6 Notes for SL spaces.pdfICS2208 Lecture6 Notes for SL spaces.pdf
ICS2208 Lecture6 Notes for SL spaces.pdf
 
YOUVE GOT EMAIL_FINALS_EL_DORADO_2024.pptx
YOUVE GOT EMAIL_FINALS_EL_DORADO_2024.pptxYOUVE GOT EMAIL_FINALS_EL_DORADO_2024.pptx
YOUVE GOT EMAIL_FINALS_EL_DORADO_2024.pptx
 
INTRODUCTION TO CATHOLIC CHRISTOLOGY.pptx
INTRODUCTION TO CATHOLIC CHRISTOLOGY.pptxINTRODUCTION TO CATHOLIC CHRISTOLOGY.pptx
INTRODUCTION TO CATHOLIC CHRISTOLOGY.pptx
 
Paradigm shift in nursing research by RS MEHTA
Paradigm shift in nursing research by RS MEHTAParadigm shift in nursing research by RS MEHTA
Paradigm shift in nursing research by RS MEHTA
 
How to Add Barcode on PDF Report in Odoo 17
How to Add Barcode on PDF Report in Odoo 17How to Add Barcode on PDF Report in Odoo 17
How to Add Barcode on PDF Report in Odoo 17
 
4.16.24 Poverty and Precarity--Desmond.pptx
4.16.24 Poverty and Precarity--Desmond.pptx4.16.24 Poverty and Precarity--Desmond.pptx
4.16.24 Poverty and Precarity--Desmond.pptx
 
Inclusivity Essentials_ Creating Accessible Websites for Nonprofits .pdf
Inclusivity Essentials_ Creating Accessible Websites for Nonprofits .pdfInclusivity Essentials_ Creating Accessible Websites for Nonprofits .pdf
Inclusivity Essentials_ Creating Accessible Websites for Nonprofits .pdf
 
Textual Evidence in Reading and Writing of SHS
Textual Evidence in Reading and Writing of SHSTextual Evidence in Reading and Writing of SHS
Textual Evidence in Reading and Writing of SHS
 
Integumentary System SMP B. Pharm Sem I.ppt
Integumentary System SMP B. Pharm Sem I.pptIntegumentary System SMP B. Pharm Sem I.ppt
Integumentary System SMP B. Pharm Sem I.ppt
 
How to do quick user assign in kanban in Odoo 17 ERP
How to do quick user assign in kanban in Odoo 17 ERPHow to do quick user assign in kanban in Odoo 17 ERP
How to do quick user assign in kanban in Odoo 17 ERP
 
Presentation Activity 2. Unit 3 transv.pptx
Presentation Activity 2. Unit 3 transv.pptxPresentation Activity 2. Unit 3 transv.pptx
Presentation Activity 2. Unit 3 transv.pptx
 
TEACHER REFLECTION FORM (NEW SET........).docx
TEACHER REFLECTION FORM (NEW SET........).docxTEACHER REFLECTION FORM (NEW SET........).docx
TEACHER REFLECTION FORM (NEW SET........).docx
 
LEFT_ON_C'N_ PRELIMS_EL_DORADO_2024.pptx
LEFT_ON_C'N_ PRELIMS_EL_DORADO_2024.pptxLEFT_ON_C'N_ PRELIMS_EL_DORADO_2024.pptx
LEFT_ON_C'N_ PRELIMS_EL_DORADO_2024.pptx
 
HỌC TỐT TIẾNG ANH 11 THEO CHƯƠNG TRÌNH GLOBAL SUCCESS ĐÁP ÁN CHI TIẾT - CẢ NĂ...
HỌC TỐT TIẾNG ANH 11 THEO CHƯƠNG TRÌNH GLOBAL SUCCESS ĐÁP ÁN CHI TIẾT - CẢ NĂ...HỌC TỐT TIẾNG ANH 11 THEO CHƯƠNG TRÌNH GLOBAL SUCCESS ĐÁP ÁN CHI TIẾT - CẢ NĂ...
HỌC TỐT TIẾNG ANH 11 THEO CHƯƠNG TRÌNH GLOBAL SUCCESS ĐÁP ÁN CHI TIẾT - CẢ NĂ...
 
Visit to a blind student's school🧑‍🦯🧑‍🦯(community medicine)
Visit to a blind student's school🧑‍🦯🧑‍🦯(community medicine)Visit to a blind student's school🧑‍🦯🧑‍🦯(community medicine)
Visit to a blind student's school🧑‍🦯🧑‍🦯(community medicine)
 

3 measure of dispersion

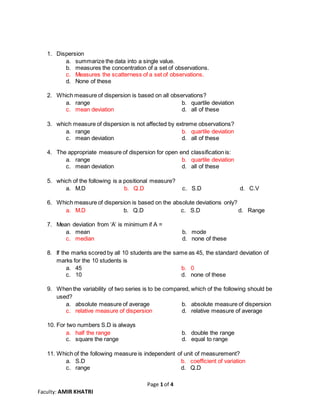
  • 1. Page 1 of 4 Faculty: AMIR KHATRI 1. Dispersion a. summarize the data into a single value. b. measures the concentration of a set of observations. c. Measures the scatterness of a set of observations. d. None of these 2. Which measure of dispersion is based on all observations? a. range b. quartile deviation c. mean deviation d. all of these 3. which measure of dispersion is not affected by extreme observations? a. range b. quartile deviation c. mean deviation d. all of these 4. The appropriate measure of dispersion for open end classification is: a. range b. quartile deviation c. mean deviation d. all of these 5. which of the following is a positional measure? a. M.D b. Q.D c. S.D d. C.V 6. Which measure of dispersion is based on the absolute deviations only? a. M.D b. Q.D c. S.D d. Range 7. Mean deviation from ‘A’ is minimum if A = a. mean b. mode c. median d. none of these 8. If the marks scored by all 10 students are the same as 45, the standard deviation of marks for the 10 students is a. 45 b. 0 c. 10 d. none of these 9. When the variability of two series is to be compared, which of the following should be used? a. absolute measure of average b. absolute measure of dispersion c. relative measure of dispersion d. relative measure of average 10. For two numbers S.D is always a. half the range b. double the range c. square the range d. equal to range 11. Which of the following measure is independent of unit of measurement? a. S.D b. coefficient of variation c. range d. Q.D
  • 2. Page 2 of 4 Faculty: AMIR KHATRI 12. If each & every observations are decreased by 2 then M.D of new observation a. decreases by 2 b. remains same c. increases by 2 d. none of these 13. If all the observations are multipliedby 3, a. C.V is also three times the previous C.V b. S.D remains unchanged c. C.V remains unchanged d. none of these 14. If x &y are related by y = 3x + 4 & M.D from median & median of x is 3 & 16 respectively, then find the coefficient of M.D from median for y is a. 0.19 b. 0.25 c. 0.058 d. 0.17 15. The variance of a set of data is 9. If every item is doubled then what will be the variance of the resulting data set? a. 9 b. 36 c. 18 d. 4.5 16. The coefficient of mean deviation of first five natural numbers is a. 0.3 b. 0.4 c. 0.5 d. 0.7 17. Which empirical relation is correct for symmetric distribution? a. M.D = 3 4 S.D b. M.D = 4 5 S.D c. M.D = 4 3 S.D d. M.D = 5 4 S.D 18. Q.D is …….. of S.D in a symmetric distribution. a. 1/3 b. 2/3 c. 1/4 d. ¾ 19. The following information is available on two group I & II. Find combined standard deviation. Group I n1 = 10, 𝑥̅1 = 28, S1 = 35 Group II n2 = 20, 𝑥̅2 = 24, S2 = 35 a. 1228.50 b. 35.50 c. 1822.05 d. 35.05 20. Sum of 20 observations is 420 & the sum of the positive deviations taken from mean is 180. Then find coefficient of deviation a. 3 7 b. 60 7 c. 9 d. 21 21. ∑( 𝑥 − 20) = 0, ∑( 𝑥 − 20)2 = 400𝑛. Find C.V a. 0 b. 100 c. 20 d. 2000
  • 3. Page 3 of 4 Faculty: AMIR KHATRI 22. Mean & S.D of 10 observations are 80 & 4 respectively. Find the sum of squares of observations. a. 64160 b. 680 c. 46.4 d. none of these 23. Find mean deviation from median for 5, 5, 5, 5, 5, 5. a. 0 b. 5 c. 1 d. none of these 24. The M.D of 1, 2, 3, 4, 5, 6, 7, hence M.D of 2.7, 4.7, 6.7, 8.7, 10.7, 12.7, 14.7 is a. 3.42 b. 1.78 c. 3.49 d. none of these 25. A shift of scale has no impact on a. Range b. Q.D c. S.D d. C.V 26. If every item in a series is increased by the same quantity, the quartile deviation a. increases by the same quantity b. decreases by the same quantity c. remain same d. increases by the square of that quantity 27. If the S.D of x is 3.5, what is the variance of (10 – 2x)? a. 49 b. 3 c. -14.5 d. 51 28. If all the observations in a data is increased by the same quantity then which of the following is true? a. range decreasesby same quantity b. standard deviation remains unchanged c. coefficient of variations increases d. both (b) & (c) 29. If x & y are related by 2y = 3x +10, then a. 2Ry = Rx b. 2Ry = 3Rx + 10 c. 2Ry = 3Rx d. Ry = 3Rx 30. If each observation of a raw data whose variance is k is multiplied by m, then variance of the new set is: a. k2 m2 b. km2 c. km d. √ 𝑘 𝑚 31. The quartile deviation of a variable y is Q. the quartile deviation of the variable 𝑎1 𝑦+ 𝑎2 𝑎3 is a. | 𝑎1 𝑎3 |Q b. | 𝑎1|Q c. 𝑎1 𝑄+ 𝑎2 𝑎3 d. none of these 32. If 2 C.V = 7 𝑥̅ & 2S.D = 7 𝑥̅. Find 𝑥̅. a. 100 b. 1 c. 3.5 d. none of these
  • 4. Page 4 of 4 Faculty: AMIR KHATRI 33. Mean & variance of 10 observations are 15 & 4. If one observation was taken as 12 instead of 21. Find correct 𝑥̅ & S.D. a. 15, 4.23 b. 15.9, 4 c. 15.9, 4.23 d. none of these 34. For the data given below obtain combined S.D. A 𝑥̅ = 35, ∑ 𝑥 = 875, S1 = 1 B n = 25, 𝑥̅ = 45, ∑ 𝑥2 = 50725 a. 2.45 b. 5.24 c. 5.42 d. 4.25 35. Sum & difference between the two extreme qaurtiles is 298 & 18 respectively. Compute coefficient of quartile deviation. a. 0.06 b. 16.56 c. 9 d. 149 36. The deviation taken from mean are -12, -6, 0, 8, 10. Calculate mean deviation from mean. a. 68.8 b. 0 c. 7.2 d. 8.29 37. Quartile deviation of 1, 2, 3, 4, 5, 6, 7 is 2 hence find the quartile deviation of 6.6, 9.6, 12.6, 15.6, 18.6, 21.6, 24.6. a. 6 b. 3.2 c. 7.2 d. 9.6 38. For a data having two observations, standard deviation is 4. Then range is a. 8 b. 2 c. 1 d. none of these 39. For two data sets, number of obsewrvations & means are equal to 50. If combined standard deviation is 5 then whichj of the following is true? a. S1 + S2 = 5 b. S1 + S2 = 50 c. 𝑆1 2 + 𝑆2 2 = 50 d. 𝑆1 2 + 𝑆2 2 = 5 40. If sum, sum of deviations & sum of squares of deviations from mean for 10 observations is 590, 216 & 6488 respectively, then coeffucient of mean deviation is a. 0.37 b. 11 c. 3 d. 21.6