SlideShare a Scribd company logo
1 of 2
Download to read offline
Tableau Desktop
                      active dashboards, visual data explo-
                         ration and more

Create and share amazing data analytics in minutes                                            www.m-focus.co.th

Tableau puts the power of visual analysis at your fingertips.

Tableau Desktop is a software application based on a technology breakthrough from Stanford University.
It lets you graphically analyze virtually any structured data to produce beautiful charts, graphs,
dashboards and reports in minutes. With Tableau’s easy to use drag-n-drop interface you'll be quickly
customizing views, layouts, shapes, colors and more to help you present your data insights.


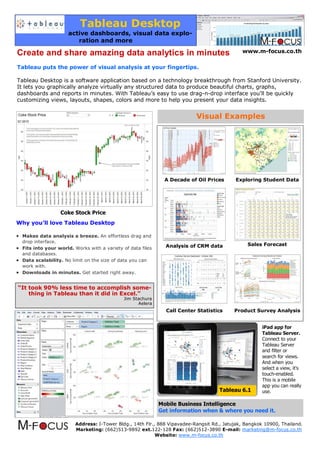
                                                                           Visual Examples


                                                               A Decade of Oil Prices       Exploring Student Data


                    Coke Stock Price
Why you’ll love Tableau Desktop
                                                                                              A Hospital Administ
• Makes data analysis a breeze. An effortless drag and
  drop interface.
                                                               Analysis of CRM data              Sales Forecast
• Fits into your world. Works with a variety of data files
  and databases.
• Data scalability. No limit on the size of data you can
  work with.
• Downloads in minutes. Get started right away.

“It took 90% less time to accomplish some-
    thing in Tableau than it did in Excel.”
                                              Jim Stachura
                                                    Aelera
                                                               Call Center Statistics      Product Survey Analysis


                                                                                                       iPad app for
                                                                                                       Tableau Server.
                                                                                                       Connect to your
                                                                                                       Tableau Server
                                                                                                       and filter or
                                                                                                       search for views.
                                                                                                       And when you
                                                                                                       select a view, it's
                                                                                                       touch-enabled.
                                                                                                       This is a mobile
                                                                                                       app you can really
                                                                                     Tableau 6.1       use.

                                                             Mobile Business Intelligence
                                                             Get information when & where you need it.

                         Address: I-Tower Bldg., 14th Flr., 888 Vipavadee-Rangsit Rd., Jatujak, Bangkok 10900, Thailand.
                         Marketing: (662)513-9892 ext.122-128 Fax: (662)512-3890 E-mail: marketing@m-focus.co.th
                                                           Website: www.m-focus.co.th
Features
Both Tableau Desktop Professional and Tableau Desktop Personal include all analysis & visualization features.


Explore                                                            Visualize
•   Answer any question with an easy drag & drop interface.        •   Convert numbers into multi-dimensional visualizations.
•   Understand databases and spreadsheets of any size.             •   Look at unlimited factors simultaneously.
•   Display information visually in seconds.                       •   In one click, create interactive maps.
•   Answer a series of questions using interactive visual analy-   •   Add one factor at a time to understand its effects.
    sis.                                                           •   Find answers using the science of information visualiza-
                                                                       tion.
Dashboard
•   Combine different databases into a single view.                Analyze
•   Highlight and filter related data across all the displays.     •   Filter and zoom into data.
•   Publish interactive dashboards to the web.                     •   Make on-the-fly calculations and groups.
•   Insert web pages and documents for greater explanation         •   Create detailed analytical maps from your location data.
    and insight.                                                   •   Compute growth, moving averages, totals, and more.
•   Create dashboards based on live data.                          •   Analyze time series: Drill from years to months to sec-
                                                                       onds.


Share
• Publish to Tableau Server to deliver web- based analytics with Desktop Professional. To view or interact, Tableau
    Server requires Desktop users to have Interactor or Viewer licenses.
•   Add beautiful formatting and annotations to web results.
•   Create analytic workflows to guide users through your results.
•   Export to PowerPoint, PDF and other applications.
•   Save as a packaged workbook for users of our free Reader application.


Tech Specs
Tableau Desktop Professional                                           Tableau Desktop Personal

Opens data from:                                                       Opens data from:
Firebird 2.0 or later, Hyperion Essbase 7x and System 9 or             Excel, Access, text files, and Tableau data extracts.
later, IBM DB2 8.0 or later (running on pSeries or xSeries),
Microsoft Access 2000 or later, Microsoft Analysis Services
2000, 2005, or 2008, Microsoft Excel 2000 or later, Microsoft
                                                                       File Sharing:
SQL Server 2000, 2005, or 2008, MySQL 3.23 or later,                   Creates package files for Tableau Reader
Netezza release 3 or later (requires Netezza ODBC driver ver-
sion 3.1.4 or later), Oracle 9i or later, PostgreSQL 7.0 or later,     System Requirements:
Teradata 6 or later, Text files, comma delimited format, Ver-          Microsoft® Windows® 7, Vista, XP, 2000, Server 2008,
tica 2.2.0 or later, Greenplum 3.3 and later, Microsoft Power-         Server 2003
Pivot files published in Sharepoint 2010, ParAccel Analytic Da-        55 megabytes minimum free disk space
tabase (PADB) version 2 and later, Sybase IQ 12 and later,             32-bit or 64-bit versions of Windows**
and many databases that are ODBC Version 3.0 compliant.
                                                                       32-bit color depth recommended
File Sharing:
Connects to Tableau Server for web-based analytics                     Virtual Environments:
Creates package files for Tableau Reader                               Parallels, VMWare, Microsoft Virtual PC, and Citrix envi-
                                                                       ronments.*
System Requirements:
Microsoft® Windows® 7, Vista, XP, 2000, Server 2008, Server
2003                                                        Internationalization:
55 megabytes minimum free disk space                        All of Tableau’s products are Unicode enabled and com-
32-bit or 64-bit versions of Windows**                      patible with data stored in any language. The user inter-
32-bit color depth recommended                              face and supporting documentation are in English.

Virtual Environments:
Parallels, VMWare, Microsoft Virtual PC, and Citrix environ-
ments.*

Internationalization:
All of Tableau’s products are Unicode enabled and compatible
with data stored in any language. The user interface and sup-
porting documentation are in English.


                          Address: I-Tower Bldg., 14th Flr., 888 Vipavadee-Rangsit Rd., Jatujak, Bangkok 10900, Thailand.
                          Marketing: (662)513-9892 ext.122-128 Fax: (662)512-3890 E-mail: marketing@m-focus.co.th
                                                            Website: www.m-focus.co.th

More Related Content

What's hot

A Crash Course in SQL Server Administration for Reluctant Database Administra...
A Crash Course in SQL Server Administration for Reluctant Database Administra...A Crash Course in SQL Server Administration for Reluctant Database Administra...
A Crash Course in SQL Server Administration for Reluctant Database Administra...Chad Petrovay
 
Tableau Interview Questions & Answers | Tableau Interview Questions | Tableau...
Tableau Interview Questions & Answers | Tableau Interview Questions | Tableau...Tableau Interview Questions & Answers | Tableau Interview Questions | Tableau...
Tableau Interview Questions & Answers | Tableau Interview Questions | Tableau...Simplilearn
 
Building great dashboards by Mrunal Shridhar - Tableau Customer Conference 2012
Building great dashboards by Mrunal Shridhar - Tableau Customer Conference 2012Building great dashboards by Mrunal Shridhar - Tableau Customer Conference 2012
Building great dashboards by Mrunal Shridhar - Tableau Customer Conference 2012Mrunal Shridhar
 
Data Visualisation & Analytics with Tableau (Beginner) - by Maria Koumandraki
Data Visualisation & Analytics with Tableau (Beginner) - by Maria KoumandrakiData Visualisation & Analytics with Tableau (Beginner) - by Maria Koumandraki
Data Visualisation & Analytics with Tableau (Beginner) - by Maria KoumandrakiOutreach Digital
 
How does Microsoft solve Big Data?
How does Microsoft solve Big Data?How does Microsoft solve Big Data?
How does Microsoft solve Big Data?James Serra
 
How to Improve Data Analysis Through Visualization in Tableau
How to Improve Data Analysis Through Visualization in TableauHow to Improve Data Analysis Through Visualization in Tableau
How to Improve Data Analysis Through Visualization in TableauEdureka!
 
Is the traditional data warehouse dead?
Is the traditional data warehouse dead?Is the traditional data warehouse dead?
Is the traditional data warehouse dead?James Serra
 
DSPanel's Cure for the Common Report
DSPanel's Cure for the Common ReportDSPanel's Cure for the Common Report
DSPanel's Cure for the Common ReportJennifer Howell
 
Creating a Tabular Model Using SQL Server 2012 Analysis Services
Creating a Tabular Model Using SQL Server 2012 Analysis ServicesCreating a Tabular Model Using SQL Server 2012 Analysis Services
Creating a Tabular Model Using SQL Server 2012 Analysis ServicesCode Mastery
 
Data Visualization Trends - Next Steps for Tableau
Data Visualization Trends - Next Steps for TableauData Visualization Trends - Next Steps for Tableau
Data Visualization Trends - Next Steps for TableauArunima Gupta
 
Tableau interview questions
Tableau interview questionsTableau interview questions
Tableau interview questionsbarbie0909
 
Tableau slideshare
Tableau slideshareTableau slideshare
Tableau slideshareSakshi Jain
 
Tableau Visual analytics complete deck 2
Tableau Visual analytics complete deck 2Tableau Visual analytics complete deck 2
Tableau Visual analytics complete deck 2Arun K
 
Tableau Tutorial For Beginners | Tableau Training For Beginners | Tableau Cer...
Tableau Tutorial For Beginners | Tableau Training For Beginners | Tableau Cer...Tableau Tutorial For Beginners | Tableau Training For Beginners | Tableau Cer...
Tableau Tutorial For Beginners | Tableau Training For Beginners | Tableau Cer...Edureka!
 
Power pivot datasheet__iw
Power pivot datasheet__iwPower pivot datasheet__iw
Power pivot datasheet__iwKlaudiia Jacome
 

What's hot (20)

A Crash Course in SQL Server Administration for Reluctant Database Administra...
A Crash Course in SQL Server Administration for Reluctant Database Administra...A Crash Course in SQL Server Administration for Reluctant Database Administra...
A Crash Course in SQL Server Administration for Reluctant Database Administra...
 
Tableau Interview Questions & Answers | Tableau Interview Questions | Tableau...
Tableau Interview Questions & Answers | Tableau Interview Questions | Tableau...Tableau Interview Questions & Answers | Tableau Interview Questions | Tableau...
Tableau Interview Questions & Answers | Tableau Interview Questions | Tableau...
 
My tableau
My tableauMy tableau
My tableau
 
Building great dashboards by Mrunal Shridhar - Tableau Customer Conference 2012
Building great dashboards by Mrunal Shridhar - Tableau Customer Conference 2012Building great dashboards by Mrunal Shridhar - Tableau Customer Conference 2012
Building great dashboards by Mrunal Shridhar - Tableau Customer Conference 2012
 
Tableau
TableauTableau
Tableau
 
Data Visualisation & Analytics with Tableau (Beginner) - by Maria Koumandraki
Data Visualisation & Analytics with Tableau (Beginner) - by Maria KoumandrakiData Visualisation & Analytics with Tableau (Beginner) - by Maria Koumandraki
Data Visualisation & Analytics with Tableau (Beginner) - by Maria Koumandraki
 
Introduction to Tableau
Introduction to Tableau Introduction to Tableau
Introduction to Tableau
 
Data Visualization with Tableau - by Knowledgebee Trainings
Data Visualization with Tableau - by Knowledgebee TrainingsData Visualization with Tableau - by Knowledgebee Trainings
Data Visualization with Tableau - by Knowledgebee Trainings
 
How does Microsoft solve Big Data?
How does Microsoft solve Big Data?How does Microsoft solve Big Data?
How does Microsoft solve Big Data?
 
How to Improve Data Analysis Through Visualization in Tableau
How to Improve Data Analysis Through Visualization in TableauHow to Improve Data Analysis Through Visualization in Tableau
How to Improve Data Analysis Through Visualization in Tableau
 
Is the traditional data warehouse dead?
Is the traditional data warehouse dead?Is the traditional data warehouse dead?
Is the traditional data warehouse dead?
 
DSPanel's Cure for the Common Report
DSPanel's Cure for the Common ReportDSPanel's Cure for the Common Report
DSPanel's Cure for the Common Report
 
Creating a Tabular Model Using SQL Server 2012 Analysis Services
Creating a Tabular Model Using SQL Server 2012 Analysis ServicesCreating a Tabular Model Using SQL Server 2012 Analysis Services
Creating a Tabular Model Using SQL Server 2012 Analysis Services
 
Data Visualization Trends - Next Steps for Tableau
Data Visualization Trends - Next Steps for TableauData Visualization Trends - Next Steps for Tableau
Data Visualization Trends - Next Steps for Tableau
 
Tableau interview questions
Tableau interview questionsTableau interview questions
Tableau interview questions
 
Tableau slideshare
Tableau slideshareTableau slideshare
Tableau slideshare
 
Tableau Visual analytics complete deck 2
Tableau Visual analytics complete deck 2Tableau Visual analytics complete deck 2
Tableau Visual analytics complete deck 2
 
Tableau
TableauTableau
Tableau
 
Tableau Tutorial For Beginners | Tableau Training For Beginners | Tableau Cer...
Tableau Tutorial For Beginners | Tableau Training For Beginners | Tableau Cer...Tableau Tutorial For Beginners | Tableau Training For Beginners | Tableau Cer...
Tableau Tutorial For Beginners | Tableau Training For Beginners | Tableau Cer...
 
Power pivot datasheet__iw
Power pivot datasheet__iwPower pivot datasheet__iw
Power pivot datasheet__iw
 

Viewers also liked

Intelligent design tableau 3
Intelligent design tableau 3Intelligent design tableau 3
Intelligent design tableau 3alok khobragade
 
Whitepaper tableau for-the-enterprise-0
Whitepaper tableau for-the-enterprise-0Whitepaper tableau for-the-enterprise-0
Whitepaper tableau for-the-enterprise-0alok khobragade
 
What's Next in Growth? 2016
What's Next in Growth? 2016What's Next in Growth? 2016
What's Next in Growth? 2016Andrew Chen
 
The Outcome Economy
The Outcome EconomyThe Outcome Economy
The Outcome EconomyHelge Tennø
 

Viewers also liked (6)

Ab ap faq
Ab ap faqAb ap faq
Ab ap faq
 
Intelligent design tableau 3
Intelligent design tableau 3Intelligent design tableau 3
Intelligent design tableau 3
 
Whitepaper tableau for-the-enterprise-0
Whitepaper tableau for-the-enterprise-0Whitepaper tableau for-the-enterprise-0
Whitepaper tableau for-the-enterprise-0
 
Informatica ppt
Informatica pptInformatica ppt
Informatica ppt
 
What's Next in Growth? 2016
What's Next in Growth? 2016What's Next in Growth? 2016
What's Next in Growth? 2016
 
The Outcome Economy
The Outcome EconomyThe Outcome Economy
The Outcome Economy
 

Similar to Tableau desktop ipad

Tableau product overview 10.3
Tableau product overview 10.3Tableau product overview 10.3
Tableau product overview 10.3Irwan Syah
 
Best Tableau training in Chandigarh.pptx
Best Tableau training in Chandigarh.pptxBest Tableau training in Chandigarh.pptx
Best Tableau training in Chandigarh.pptxRykaBhatt
 
Accelerate Self-Service Analytics with Virtualization and Visualisation (Thai)
Accelerate Self-Service Analytics with Virtualization and Visualisation (Thai)Accelerate Self-Service Analytics with Virtualization and Visualisation (Thai)
Accelerate Self-Service Analytics with Virtualization and Visualisation (Thai)Denodo
 
Microsoft Fabric Introduction
Microsoft Fabric IntroductionMicrosoft Fabric Introduction
Microsoft Fabric IntroductionJames Serra
 
Tableau Course In Chennai-October
Tableau Course In Chennai-OctoberTableau Course In Chennai-October
Tableau Course In Chennai-OctoberDataMites
 
NLS Banking Solutions - NQuest BI
NLS Banking Solutions - NQuest BINLS Banking Solutions - NQuest BI
NLS Banking Solutions - NQuest BIkarthik nagarajan
 
Introduction to Azure Databricks
Introduction to Azure DatabricksIntroduction to Azure Databricks
Introduction to Azure DatabricksJames Serra
 
Logitech - LOGITECH ACCELERATES CLOUD ANALYTICS USING DATA VIRTUALIZATION
Logitech - LOGITECH ACCELERATES CLOUD ANALYTICS USING DATA VIRTUALIZATIONLogitech - LOGITECH ACCELERATES CLOUD ANALYTICS USING DATA VIRTUALIZATION
Logitech - LOGITECH ACCELERATES CLOUD ANALYTICS USING DATA VIRTUALIZATIONAvinash Deshpande
 
Tableau (BI) interview questions version 2.0
Tableau (BI) interview questions version 2.0Tableau (BI) interview questions version 2.0
Tableau (BI) interview questions version 2.0Visualect
 
10 Features of Tableau to Smoothen your Data Visualization Tasks
10 Features of Tableau to Smoothen your Data Visualization Tasks10 Features of Tableau to Smoothen your Data Visualization Tasks
10 Features of Tableau to Smoothen your Data Visualization TasksSudhanshiBakre1
 
Overview of tools for data analysis and visualisation (2021)
Overview of tools for data analysis and visualisation (2021)Overview of tools for data analysis and visualisation (2021)
Overview of tools for data analysis and visualisation (2021)Marié Roux
 
10 Features of Tableau to Smoothen your Data Visualization Tasks.pptx
10 Features of Tableau to Smoothen your Data Visualization Tasks.pptx10 Features of Tableau to Smoothen your Data Visualization Tasks.pptx
10 Features of Tableau to Smoothen your Data Visualization Tasks.pptxSudhanshiBakre1
 
Tableau Course In Bangalore-October
Tableau Course In Bangalore-OctoberTableau Course In Bangalore-October
Tableau Course In Bangalore-OctoberDataMites
 
Doing data visualizations with tableau
Doing data visualizations with tableauDoing data visualizations with tableau
Doing data visualizations with tableauRay Schwartz
 
Tableau7 0prsentation-120704025343-phpapp02
Tableau7 0prsentation-120704025343-phpapp02Tableau7 0prsentation-120704025343-phpapp02
Tableau7 0prsentation-120704025343-phpapp02Rahul Jain
 
Accelerate Self-Service Analytics with Data Virtualization and Visualization
Accelerate Self-Service Analytics with Data Virtualization and VisualizationAccelerate Self-Service Analytics with Data Virtualization and Visualization
Accelerate Self-Service Analytics with Data Virtualization and VisualizationDenodo
 
IT7113 research project_group_4
IT7113 research project_group_4IT7113 research project_group_4
IT7113 research project_group_4ethanlchandler
 

Similar to Tableau desktop ipad (20)

Tableau product overview 10.3
Tableau product overview 10.3Tableau product overview 10.3
Tableau product overview 10.3
 
Data visualization-tools
Data visualization-toolsData visualization-tools
Data visualization-tools
 
Best Tableau training in Chandigarh.pptx
Best Tableau training in Chandigarh.pptxBest Tableau training in Chandigarh.pptx
Best Tableau training in Chandigarh.pptx
 
Accelerate Self-Service Analytics with Virtualization and Visualisation (Thai)
Accelerate Self-Service Analytics with Virtualization and Visualisation (Thai)Accelerate Self-Service Analytics with Virtualization and Visualisation (Thai)
Accelerate Self-Service Analytics with Virtualization and Visualisation (Thai)
 
Microsoft Fabric Introduction
Microsoft Fabric IntroductionMicrosoft Fabric Introduction
Microsoft Fabric Introduction
 
Tableau Course In Chennai-October
Tableau Course In Chennai-OctoberTableau Course In Chennai-October
Tableau Course In Chennai-October
 
Future.ready().watson dataplatform 01
Future.ready().watson dataplatform 01Future.ready().watson dataplatform 01
Future.ready().watson dataplatform 01
 
NLS Banking Solutions - NQuest BI
NLS Banking Solutions - NQuest BINLS Banking Solutions - NQuest BI
NLS Banking Solutions - NQuest BI
 
Introduction to Azure Databricks
Introduction to Azure DatabricksIntroduction to Azure Databricks
Introduction to Azure Databricks
 
Logitech - LOGITECH ACCELERATES CLOUD ANALYTICS USING DATA VIRTUALIZATION
Logitech - LOGITECH ACCELERATES CLOUD ANALYTICS USING DATA VIRTUALIZATIONLogitech - LOGITECH ACCELERATES CLOUD ANALYTICS USING DATA VIRTUALIZATION
Logitech - LOGITECH ACCELERATES CLOUD ANALYTICS USING DATA VIRTUALIZATION
 
Tableau
TableauTableau
Tableau
 
Tableau (BI) interview questions version 2.0
Tableau (BI) interview questions version 2.0Tableau (BI) interview questions version 2.0
Tableau (BI) interview questions version 2.0
 
10 Features of Tableau to Smoothen your Data Visualization Tasks
10 Features of Tableau to Smoothen your Data Visualization Tasks10 Features of Tableau to Smoothen your Data Visualization Tasks
10 Features of Tableau to Smoothen your Data Visualization Tasks
 
Overview of tools for data analysis and visualisation (2021)
Overview of tools for data analysis and visualisation (2021)Overview of tools for data analysis and visualisation (2021)
Overview of tools for data analysis and visualisation (2021)
 
10 Features of Tableau to Smoothen your Data Visualization Tasks.pptx
10 Features of Tableau to Smoothen your Data Visualization Tasks.pptx10 Features of Tableau to Smoothen your Data Visualization Tasks.pptx
10 Features of Tableau to Smoothen your Data Visualization Tasks.pptx
 
Tableau Course In Bangalore-October
Tableau Course In Bangalore-OctoberTableau Course In Bangalore-October
Tableau Course In Bangalore-October
 
Doing data visualizations with tableau
Doing data visualizations with tableauDoing data visualizations with tableau
Doing data visualizations with tableau
 
Tableau7 0prsentation-120704025343-phpapp02
Tableau7 0prsentation-120704025343-phpapp02Tableau7 0prsentation-120704025343-phpapp02
Tableau7 0prsentation-120704025343-phpapp02
 
Accelerate Self-Service Analytics with Data Virtualization and Visualization
Accelerate Self-Service Analytics with Data Virtualization and VisualizationAccelerate Self-Service Analytics with Data Virtualization and Visualization
Accelerate Self-Service Analytics with Data Virtualization and Visualization
 
IT7113 research project_group_4
IT7113 research project_group_4IT7113 research project_group_4
IT7113 research project_group_4
 

Recently uploaded

Science 7 Quarter 4 Module 2: Natural Resources.pptx
Science 7 Quarter 4 Module 2: Natural Resources.pptxScience 7 Quarter 4 Module 2: Natural Resources.pptx
Science 7 Quarter 4 Module 2: Natural Resources.pptxMaryGraceBautista27
 
Barangay Council for the Protection of Children (BCPC) Orientation.pptx
Barangay Council for the Protection of Children (BCPC) Orientation.pptxBarangay Council for the Protection of Children (BCPC) Orientation.pptx
Barangay Council for the Protection of Children (BCPC) Orientation.pptxCarlos105
 
Karra SKD Conference Presentation Revised.pptx
Karra SKD Conference Presentation Revised.pptxKarra SKD Conference Presentation Revised.pptx
Karra SKD Conference Presentation Revised.pptxAshokKarra1
 
ACC 2024 Chronicles. Cardiology. Exam.pdf
ACC 2024 Chronicles. Cardiology. Exam.pdfACC 2024 Chronicles. Cardiology. Exam.pdf
ACC 2024 Chronicles. Cardiology. Exam.pdfSpandanaRallapalli
 
Culture Uniformity or Diversity IN SOCIOLOGY.pptx
Culture Uniformity or Diversity IN SOCIOLOGY.pptxCulture Uniformity or Diversity IN SOCIOLOGY.pptx
Culture Uniformity or Diversity IN SOCIOLOGY.pptxPoojaSen20
 
ENGLISH6-Q4-W3.pptxqurter our high choom
ENGLISH6-Q4-W3.pptxqurter our high choomENGLISH6-Q4-W3.pptxqurter our high choom
ENGLISH6-Q4-W3.pptxqurter our high choomnelietumpap1
 
Grade 9 Quarter 4 Dll Grade 9 Quarter 4 DLL.pdf
Grade 9 Quarter 4 Dll Grade 9 Quarter 4 DLL.pdfGrade 9 Quarter 4 Dll Grade 9 Quarter 4 DLL.pdf
Grade 9 Quarter 4 Dll Grade 9 Quarter 4 DLL.pdfJemuel Francisco
 
4.18.24 Movement Legacies, Reflection, and Review.pptx
4.18.24 Movement Legacies, Reflection, and Review.pptx4.18.24 Movement Legacies, Reflection, and Review.pptx
4.18.24 Movement Legacies, Reflection, and Review.pptxmary850239
 
Inclusivity Essentials_ Creating Accessible Websites for Nonprofits .pdf
Inclusivity Essentials_ Creating Accessible Websites for Nonprofits .pdfInclusivity Essentials_ Creating Accessible Websites for Nonprofits .pdf
Inclusivity Essentials_ Creating Accessible Websites for Nonprofits .pdfTechSoup
 
Proudly South Africa powerpoint Thorisha.pptx
Proudly South Africa powerpoint Thorisha.pptxProudly South Africa powerpoint Thorisha.pptx
Proudly South Africa powerpoint Thorisha.pptxthorishapillay1
 
Choosing the Right CBSE School A Comprehensive Guide for Parents
Choosing the Right CBSE School A Comprehensive Guide for ParentsChoosing the Right CBSE School A Comprehensive Guide for Parents
Choosing the Right CBSE School A Comprehensive Guide for Parentsnavabharathschool99
 
Field Attribute Index Feature in Odoo 17
Field Attribute Index Feature in Odoo 17Field Attribute Index Feature in Odoo 17
Field Attribute Index Feature in Odoo 17Celine George
 
Visit to a blind student's school🧑‍🦯🧑‍🦯(community medicine)
Visit to a blind student's school🧑‍🦯🧑‍🦯(community medicine)Visit to a blind student's school🧑‍🦯🧑‍🦯(community medicine)
Visit to a blind student's school🧑‍🦯🧑‍🦯(community medicine)lakshayb543
 
MULTIDISCIPLINRY NATURE OF THE ENVIRONMENTAL STUDIES.pptx
MULTIDISCIPLINRY NATURE OF THE ENVIRONMENTAL STUDIES.pptxMULTIDISCIPLINRY NATURE OF THE ENVIRONMENTAL STUDIES.pptx
MULTIDISCIPLINRY NATURE OF THE ENVIRONMENTAL STUDIES.pptxAnupkumar Sharma
 
Virtual-Orientation-on-the-Administration-of-NATG12-NATG6-and-ELLNA.pdf
Virtual-Orientation-on-the-Administration-of-NATG12-NATG6-and-ELLNA.pdfVirtual-Orientation-on-the-Administration-of-NATG12-NATG6-and-ELLNA.pdf
Virtual-Orientation-on-the-Administration-of-NATG12-NATG6-and-ELLNA.pdfErwinPantujan2
 
AUDIENCE THEORY -CULTIVATION THEORY - GERBNER.pptx
AUDIENCE THEORY -CULTIVATION THEORY -  GERBNER.pptxAUDIENCE THEORY -CULTIVATION THEORY -  GERBNER.pptx
AUDIENCE THEORY -CULTIVATION THEORY - GERBNER.pptxiammrhaywood
 
Like-prefer-love -hate+verb+ing & silent letters & citizenship text.pdf
Like-prefer-love -hate+verb+ing & silent letters & citizenship text.pdfLike-prefer-love -hate+verb+ing & silent letters & citizenship text.pdf
Like-prefer-love -hate+verb+ing & silent letters & citizenship text.pdfMr Bounab Samir
 
Earth Day Presentation wow hello nice great
Earth Day Presentation wow hello nice greatEarth Day Presentation wow hello nice great
Earth Day Presentation wow hello nice greatYousafMalik24
 
Difference Between Search & Browse Methods in Odoo 17
Difference Between Search & Browse Methods in Odoo 17Difference Between Search & Browse Methods in Odoo 17
Difference Between Search & Browse Methods in Odoo 17Celine George
 

Recently uploaded (20)

Science 7 Quarter 4 Module 2: Natural Resources.pptx
Science 7 Quarter 4 Module 2: Natural Resources.pptxScience 7 Quarter 4 Module 2: Natural Resources.pptx
Science 7 Quarter 4 Module 2: Natural Resources.pptx
 
Barangay Council for the Protection of Children (BCPC) Orientation.pptx
Barangay Council for the Protection of Children (BCPC) Orientation.pptxBarangay Council for the Protection of Children (BCPC) Orientation.pptx
Barangay Council for the Protection of Children (BCPC) Orientation.pptx
 
Karra SKD Conference Presentation Revised.pptx
Karra SKD Conference Presentation Revised.pptxKarra SKD Conference Presentation Revised.pptx
Karra SKD Conference Presentation Revised.pptx
 
ACC 2024 Chronicles. Cardiology. Exam.pdf
ACC 2024 Chronicles. Cardiology. Exam.pdfACC 2024 Chronicles. Cardiology. Exam.pdf
ACC 2024 Chronicles. Cardiology. Exam.pdf
 
Culture Uniformity or Diversity IN SOCIOLOGY.pptx
Culture Uniformity or Diversity IN SOCIOLOGY.pptxCulture Uniformity or Diversity IN SOCIOLOGY.pptx
Culture Uniformity or Diversity IN SOCIOLOGY.pptx
 
ENGLISH6-Q4-W3.pptxqurter our high choom
ENGLISH6-Q4-W3.pptxqurter our high choomENGLISH6-Q4-W3.pptxqurter our high choom
ENGLISH6-Q4-W3.pptxqurter our high choom
 
Grade 9 Quarter 4 Dll Grade 9 Quarter 4 DLL.pdf
Grade 9 Quarter 4 Dll Grade 9 Quarter 4 DLL.pdfGrade 9 Quarter 4 Dll Grade 9 Quarter 4 DLL.pdf
Grade 9 Quarter 4 Dll Grade 9 Quarter 4 DLL.pdf
 
4.18.24 Movement Legacies, Reflection, and Review.pptx
4.18.24 Movement Legacies, Reflection, and Review.pptx4.18.24 Movement Legacies, Reflection, and Review.pptx
4.18.24 Movement Legacies, Reflection, and Review.pptx
 
Inclusivity Essentials_ Creating Accessible Websites for Nonprofits .pdf
Inclusivity Essentials_ Creating Accessible Websites for Nonprofits .pdfInclusivity Essentials_ Creating Accessible Websites for Nonprofits .pdf
Inclusivity Essentials_ Creating Accessible Websites for Nonprofits .pdf
 
Proudly South Africa powerpoint Thorisha.pptx
Proudly South Africa powerpoint Thorisha.pptxProudly South Africa powerpoint Thorisha.pptx
Proudly South Africa powerpoint Thorisha.pptx
 
Choosing the Right CBSE School A Comprehensive Guide for Parents
Choosing the Right CBSE School A Comprehensive Guide for ParentsChoosing the Right CBSE School A Comprehensive Guide for Parents
Choosing the Right CBSE School A Comprehensive Guide for Parents
 
Field Attribute Index Feature in Odoo 17
Field Attribute Index Feature in Odoo 17Field Attribute Index Feature in Odoo 17
Field Attribute Index Feature in Odoo 17
 
Visit to a blind student's school🧑‍🦯🧑‍🦯(community medicine)
Visit to a blind student's school🧑‍🦯🧑‍🦯(community medicine)Visit to a blind student's school🧑‍🦯🧑‍🦯(community medicine)
Visit to a blind student's school🧑‍🦯🧑‍🦯(community medicine)
 
FINALS_OF_LEFT_ON_C'N_EL_DORADO_2024.pptx
FINALS_OF_LEFT_ON_C'N_EL_DORADO_2024.pptxFINALS_OF_LEFT_ON_C'N_EL_DORADO_2024.pptx
FINALS_OF_LEFT_ON_C'N_EL_DORADO_2024.pptx
 
MULTIDISCIPLINRY NATURE OF THE ENVIRONMENTAL STUDIES.pptx
MULTIDISCIPLINRY NATURE OF THE ENVIRONMENTAL STUDIES.pptxMULTIDISCIPLINRY NATURE OF THE ENVIRONMENTAL STUDIES.pptx
MULTIDISCIPLINRY NATURE OF THE ENVIRONMENTAL STUDIES.pptx
 
Virtual-Orientation-on-the-Administration-of-NATG12-NATG6-and-ELLNA.pdf
Virtual-Orientation-on-the-Administration-of-NATG12-NATG6-and-ELLNA.pdfVirtual-Orientation-on-the-Administration-of-NATG12-NATG6-and-ELLNA.pdf
Virtual-Orientation-on-the-Administration-of-NATG12-NATG6-and-ELLNA.pdf
 
AUDIENCE THEORY -CULTIVATION THEORY - GERBNER.pptx
AUDIENCE THEORY -CULTIVATION THEORY -  GERBNER.pptxAUDIENCE THEORY -CULTIVATION THEORY -  GERBNER.pptx
AUDIENCE THEORY -CULTIVATION THEORY - GERBNER.pptx
 
Like-prefer-love -hate+verb+ing & silent letters & citizenship text.pdf
Like-prefer-love -hate+verb+ing & silent letters & citizenship text.pdfLike-prefer-love -hate+verb+ing & silent letters & citizenship text.pdf
Like-prefer-love -hate+verb+ing & silent letters & citizenship text.pdf
 
Earth Day Presentation wow hello nice great
Earth Day Presentation wow hello nice greatEarth Day Presentation wow hello nice great
Earth Day Presentation wow hello nice great
 
Difference Between Search & Browse Methods in Odoo 17
Difference Between Search & Browse Methods in Odoo 17Difference Between Search & Browse Methods in Odoo 17
Difference Between Search & Browse Methods in Odoo 17
 

Tableau desktop ipad

  • 1. Tableau Desktop active dashboards, visual data explo- ration and more Create and share amazing data analytics in minutes www.m-focus.co.th Tableau puts the power of visual analysis at your fingertips. Tableau Desktop is a software application based on a technology breakthrough from Stanford University. It lets you graphically analyze virtually any structured data to produce beautiful charts, graphs, dashboards and reports in minutes. With Tableau’s easy to use drag-n-drop interface you'll be quickly customizing views, layouts, shapes, colors and more to help you present your data insights. Visual Examples A Decade of Oil Prices Exploring Student Data Coke Stock Price Why you’ll love Tableau Desktop A Hospital Administ • Makes data analysis a breeze. An effortless drag and drop interface. Analysis of CRM data Sales Forecast • Fits into your world. Works with a variety of data files and databases. • Data scalability. No limit on the size of data you can work with. • Downloads in minutes. Get started right away. “It took 90% less time to accomplish some- thing in Tableau than it did in Excel.” Jim Stachura Aelera Call Center Statistics Product Survey Analysis iPad app for Tableau Server. Connect to your Tableau Server and filter or search for views. And when you select a view, it's touch-enabled. This is a mobile app you can really Tableau 6.1 use. Mobile Business Intelligence Get information when & where you need it. Address: I-Tower Bldg., 14th Flr., 888 Vipavadee-Rangsit Rd., Jatujak, Bangkok 10900, Thailand. Marketing: (662)513-9892 ext.122-128 Fax: (662)512-3890 E-mail: marketing@m-focus.co.th Website: www.m-focus.co.th
  • 2. Features Both Tableau Desktop Professional and Tableau Desktop Personal include all analysis & visualization features. Explore Visualize • Answer any question with an easy drag & drop interface. • Convert numbers into multi-dimensional visualizations. • Understand databases and spreadsheets of any size. • Look at unlimited factors simultaneously. • Display information visually in seconds. • In one click, create interactive maps. • Answer a series of questions using interactive visual analy- • Add one factor at a time to understand its effects. sis. • Find answers using the science of information visualiza- tion. Dashboard • Combine different databases into a single view. Analyze • Highlight and filter related data across all the displays. • Filter and zoom into data. • Publish interactive dashboards to the web. • Make on-the-fly calculations and groups. • Insert web pages and documents for greater explanation • Create detailed analytical maps from your location data. and insight. • Compute growth, moving averages, totals, and more. • Create dashboards based on live data. • Analyze time series: Drill from years to months to sec- onds. Share • Publish to Tableau Server to deliver web- based analytics with Desktop Professional. To view or interact, Tableau Server requires Desktop users to have Interactor or Viewer licenses. • Add beautiful formatting and annotations to web results. • Create analytic workflows to guide users through your results. • Export to PowerPoint, PDF and other applications. • Save as a packaged workbook for users of our free Reader application. Tech Specs Tableau Desktop Professional Tableau Desktop Personal Opens data from: Opens data from: Firebird 2.0 or later, Hyperion Essbase 7x and System 9 or Excel, Access, text files, and Tableau data extracts. later, IBM DB2 8.0 or later (running on pSeries or xSeries), Microsoft Access 2000 or later, Microsoft Analysis Services 2000, 2005, or 2008, Microsoft Excel 2000 or later, Microsoft File Sharing: SQL Server 2000, 2005, or 2008, MySQL 3.23 or later, Creates package files for Tableau Reader Netezza release 3 or later (requires Netezza ODBC driver ver- sion 3.1.4 or later), Oracle 9i or later, PostgreSQL 7.0 or later, System Requirements: Teradata 6 or later, Text files, comma delimited format, Ver- Microsoft® Windows® 7, Vista, XP, 2000, Server 2008, tica 2.2.0 or later, Greenplum 3.3 and later, Microsoft Power- Server 2003 Pivot files published in Sharepoint 2010, ParAccel Analytic Da- 55 megabytes minimum free disk space tabase (PADB) version 2 and later, Sybase IQ 12 and later, 32-bit or 64-bit versions of Windows** and many databases that are ODBC Version 3.0 compliant. 32-bit color depth recommended File Sharing: Connects to Tableau Server for web-based analytics Virtual Environments: Creates package files for Tableau Reader Parallels, VMWare, Microsoft Virtual PC, and Citrix envi- ronments.* System Requirements: Microsoft® Windows® 7, Vista, XP, 2000, Server 2008, Server 2003 Internationalization: 55 megabytes minimum free disk space All of Tableau’s products are Unicode enabled and com- 32-bit or 64-bit versions of Windows** patible with data stored in any language. The user inter- 32-bit color depth recommended face and supporting documentation are in English. Virtual Environments: Parallels, VMWare, Microsoft Virtual PC, and Citrix environ- ments.* Internationalization: All of Tableau’s products are Unicode enabled and compatible with data stored in any language. The user interface and sup- porting documentation are in English. Address: I-Tower Bldg., 14th Flr., 888 Vipavadee-Rangsit Rd., Jatujak, Bangkok 10900, Thailand. Marketing: (662)513-9892 ext.122-128 Fax: (662)512-3890 E-mail: marketing@m-focus.co.th Website: www.m-focus.co.th