Seasonal variation of physicochemical parameters of water and sediments from iko river, nigeria
•
3 likes•956 views

International peer-reviewed academic journals call for papers, http://www.iiste.org/Journals

Recommended
Recommended
More Related Content
What's hot
What's hot (20)
Similar to Seasonal variation of physicochemical parameters of water and sediments from iko river, nigeria
Similar to Seasonal variation of physicochemical parameters of water and sediments from iko river, nigeria (20)
More from Alexander Decker
More from Alexander Decker (20)
Recently uploaded
Recently uploaded (20)
Seasonal variation of physicochemical parameters of water and sediments from iko river, nigeria
- 1. Journal of Environment and Earth Science www.iiste.org ISSN 2224-3216 (Paper) ISSN 2225-0948 (Online) Vol. 3, No.8, 2013 96 Seasonal Variation of Physicochemical Parameters of Water and Sediments from Iko River, Nigeria Usoro Etesin *1 , Enewan Udoinyang 2 , Thomas Harry 3 1. Chemistry Department, Akwa Ibom State University, Ikot Akpaden, Akwa Ibom State, Nigeria 2. Zoology Department, University of Uyo, Akwa Ibom State, Nigeria. 3. Geosciences Department, Akwa Ibom State University,Ikot Akpaden, Akwa Ibom State,Nigeria *Corresponding Author’s E-mail : uetesin@gmail.com. Abstract : The seasonal and locational variation of physicochemical parameters viz, p H, dissolved oxygen , biochemical oxygen demand, conductivity , salinity, chloride, sulphate, nitrate , ammonium ion , total nitrogen , total organic carbon , total hydrocarbon and exchangeable cations , in water and sediments of Iko River, South Eastern Nigeria were investigated . The import of this investigation is that Iko River , is in Iko Petroleum Belt of the Niger Delta that has suffered from years of intense petroleum exploitation , recent cases of oil bunkering in the area and moreso, its closeness to the Atlantic Ocean. In both dry and wet seasons considered , the variation of p H was not significant, and was within the WHO limit of 6.5 to 8.0 for an unpolluted streams and rivers, while the salinity , chloride and exchangeable cations , were above WHO limits , indicating a high degree of saline water intrusion and influence in the water chemistry of the river from the Atlantic Ocean. The sediment of the river had acidic characteristics and were predominantly of medium to fine grained sand ( > 70 % ) and less of silt ( < 15 % ) and clay ( < 10 % ) , indicating that Iko River is not an important sink for heavy metal and organic pollutants , implying that in a case of accidental discharge of chemical pollutants , will stay in the water column a longer time, thus accessible to the biota. Interestingly, the total hydrocarbon content of the sediments were greater than 200 mg/kg , the levels set for an area that is heavily polluted with petroleum. Based on the physicochemical parameters of the water, the pollution index determined for the wet season gave a value of 0.97, which is less than a value of 1 for an unpolluted surface water body, but gave a pollution index of 1.34 during the dry season, which could be attributed to dilution from the surface runoff. The variation of the dissolved oxygen was not significant in both seasons and were higher than 5.0 mg/l WHO limit for surface waters , and indicated a highly oxidized environment . The phosphate content of the sediment of the river was lower in both seasons than average for soils , whereas , total nitrogen, total organic carbon and sulphur contents were higher than average for soils. Keywords: Iko River, Sediments, Water, Physicochemical Parameters, Seasonal Variation, Pollution Index 1. Introduction Iko River had been an area of intense petroleum extraction activities since 1973 by Shell Petroleum Development Company Nigeria Limited, in what was referred to as the Utapete Operational Zone ( Ansa, 1998). Though , the oil exploration activities had been discontinued few years back , had created social , economic and environmental dislocations within the host communities and water bodies within the area . One of the most negative activities in Iko is the phenomenon of acid rain. The resulting high levels of acidity in the environment manifest as severe corrosion of roof sheets on houses in Iko, skin irritation , poor agricultural soils , destruction and reduction of fish life and fisheries production of the waters, deterioration of the quality of surface and ground waters ( Mobil, 1997 ; FIMSCO ,2002) . Iko River in Eastern Obolo Local Government Area, is located within the petroleum belt of the Niger Delta, thus rivers in this area are exposed to additional risk of pollution from petroleum and related sources. Iko River takes its rise from the Qua Iboe River catchment and drains directly into the Atlantic Ocean at the Bight of Bonny. The devastation in the area is also aggravated by the direct influence of seawater and the inward driving wind from the Atlantic Ocean due to its closeness. There has been a reported case of diurnal and seasonal changes in water temperature , p H , dissolved oxygen and conductivity of the water system in Iko River ( Ekpe et al, 1995 ). The river is of high economic and ecological importance, as it supports the livelihood of a large number of artisanal fishermen. Iko River runs through both mangrove and fresh water swamps with adjoining creeks and tributaries, with communities settling all along the river. Therefore, whatever environmental changes taking place in the river will affect the hydrology of the surrounding creeks and tributaries ( Imevbore, 1970; Egereonu et al,2012 ). In a study of the basic ecological features of the different sectors of the mangrove and fresh water swamp forest of Nigeria, it was shown that the ecological equilibrium is very delicate (Enyenihi et al , 1987). These effects are bound to influence the overall high productivity of the environment (The World Bank,1995 ).
- 2. Journal of Environment and Earth Science www.iiste.org ISSN 2224-3216 (Paper) ISSN 2225-0948 (Online) Vol. 3, No.8, 2013 97 Of recent , there are reported cases of oil bunkering and establishment of local refineries in Iko area , with indiscriminate dumping of petroleum residues , seepages and spillages in Iko River. The deleterious effect of these activities in the ecosystem is enormous and calls for concern. The need to protect the environment as a prerequisite for preserving the quality of life has been emphasized in 1984 by a report initiated by the South African Committee for Oceanographic Research which established water quality criteria (WQI, 1991 ). The report defined these as “ a scientific yardsticks upon which a decision or judgement may be made concerning the ability of water of a given quality to support a designated beneficial use”. Beneficial uses include preservation of ecosystem, direct contact recreation , migration of aquatic life and mineral recovery. In the general framework of the global environmental problems, and the large store of background data about the deteriorating environment, this study is initiated to monitor the spatial and seasonal distribution of petroleum hydrocarbon pollutants and interactive effects on water quality parameters in the water and sediments of Iko River. Therefore, the acquisition of accurate data on the concentration and distribution of pollutants in the coastal water and sediments of Iko River is essential in understanding the geochemical and biogeochemical cycles of the elements and to deduce the extent to which the equilibrium of the river ecosystem has been disturbed. 2. The Study Area Iko River in Eastern Obolo Local Government Area of Akwa Ibom State , Nigeria, is located within the petroleum belt of the Niger Delta , Nigeria ( Fig. 1 ). Iko River is located in the Eastern part of the Niger Delta between latitude 4o 30’’ N and 4o 45’’ N and longitude 7o 35’’ and 7o 40’’ E . The river has a shadow depth ranging from 1.0 metre to 7.0 metres at flood and ebb tide and an average width of 16metres. Iko River takes its rise from the Qua Iboe River catchment and drains directly into the Atlantic Ocean at the Bight of Bonny ( Ekpe et al , 1995). Iko River has many adjoining tributaries and creeks, and part of it also drains into Imo River estuary, which opens into the Atlantic Ocean at the Bight of Bonny. The shore line of Iko River is characterized by soft –dark mud flats, usually exposed during low tide, mangrove swamps with mangrove trees , shoals and sand bars. The river has semi-diurnal tides and has a length of more than 30 km. The climate of the area is characterized by distinct wet and dry seasons. The wet season begins in April and lasts till November, while the dry season begins in November till March. A short period of draught is usually experienced in July and August, while a period of harmattan characterized by cold dry winds and lower temperatures normally occurs between December and February ( Moses, 1979 ; Enemugwem, 2009). Iko area is characterized by a humid tropical climate with rainfall reaching about 3000 mm per annum. The mean annual daily evaporation of the area is 4.6 mm per day ( Edet and Ntekim, 1996). The hydrology of Iko River is affected by tides, although seasonal influences which are related to the climatic regime , are evident. Iko River is directly influenced by processes in the Atlantic coastal waters (Ekpe et al, 1995). Sediments in Iko River become well sorted , composed of mainly coarse quartz sand , shell debris , faecal pellets, silts and clay ( Ekwere et al , 1992 ). This assortment of sediments when trapped within the luxuriant mangrove prop roots and impregnated with decaying mangrove leaves and branches constitutes mud flats, with characteristic feature of Iko River shorelines. 3. Materials and Methods. Iko River was divided into ten sampling stations for water and sediment sampling. The sampling stations were so selected to be close to an abandoned oil well or close to an old oil pipeline ( Fig. 1 ). At each sampling point, water sample was collected in polyethylene bottles at a depth of 30 cm below the surface, while sediment sample was taken by Van Veen grab sampler ( Loring and Rantala,1992). The sampling were undertaken in dry season months of November and December , 2011, January and February, 2012 and wet season months of June, July , August and September, 2012. Some parameters that deteriorate on storage were determined at the sampling locations like temperature, p H, dissolved oxygen, conductivity, salinity, redox potential using multicombi meter. Water and sediment samples were stored in iced coolers before being transported to the laboratory for the determination of other parameters. Sediment samples were air dried and used for grain size analysis by the method of Fork ( 1994). Fresh sediment samples were used for the determination of p H , conductivity , salinity and redox potential of sediments in a 1: 1 volume suspension in water Acidity and chloride content of the water samples were determined by appropriate titrimetric techniques ( Egereonu et at, 2012 ), while dissolved oxygen and five-day biochemical oxygen demand ( BOD5 ) were determined electroanalytically by dissolved oxygen meter ( Uzoukwu et al, 2005 ). Sulphate , nitrate and nitrite were determined spectrophotometrically by standards methods ( APHA, AWWA, WPCF, 2005 ).
- 3. Journal of Environment and Earth Science www.iiste.org ISSN 2224-3216 (Paper) ISSN 2225-0948 (Online) Vol. 3, No.8, 2013 98 Chemical oxygen demand , total hydrocarbon , calcium , magnesium , sodium and potassium in water were determined by appropriate standard methods ( APHA, AWWA WPCF, 2005 ). Total carbon content of the sediments was determined on the finely ground sediment samples by Leco Elemental analyser ( CHN 1000 ), with EDTA as the calibration standard. Total organic carbon was determined by the Walkey-Black method as adopted and modified ( Rump and Krist, 1988). Total inorganic carbon was determined by the difference between total carbon and total organic carbon (Loring and Rantala, 1992 ). Total hydrocarbon content of the sediments was determined by the methods of IOC , 1982 and ROMPE, 1983. The exchangeable bases Calcium , Magnesium ,sodium and potassium were determined in the sediments by the modified method of Rump and Krist ( 1988 ), while exchangeable acidity was determined by extraction with 1 M KCl solution and titrimetry with 0.01 M NaOH ( APHA, AWWA, WPCF, 2005 ). Effective cation exchange capacity (ECEC) of the sediments was determined by the summation of exchangeable bases and acidity ( IITA, 1979), while base saturation was determined for the sediments by calculation , % Base Saturation = Exchangeable Bases / ECEC * 100. 4. Results and Discussion The mean monthly variation of physicochemical parameters of water from Iko River is presented in Table 1, while the monthly variation of physicochemical parameters of sediments from Iko River is presented in Table 2. The mean seasonal variation in physicochemical parameters is presented in Table 3, while the mean seasonal variation of physicochemical variation in sediments is presented in Table 4. Temperature of the water from Iko River gave mean values of 24.5 o C during the dry season and 24.08 o C during the wet season, as compared to the WHO limit of 25 o C for surface waters. ( Table 6 ). Conductivity of the water gave values of 76.2 m S/cm and 57.5 m S/cm during the dry and wet seasons respectively, compared to the WHO limit of 50 m S/cm. p H of the water in both seasons were within the WHO limit of 6.5 – 8.5. Dissolved oxygen of the water gave values of 7.98 mg/l and 6.01 mg/l for the dry and wet seasons respectively, compared to the WHO limit of 5 .0 mg/l for surface waters. Thus, the values indicated an oxidized environment. The total hydrocarbon gave values of 44.1 mg/l and 35.59 mg/l during the dry and wet seasons respectively, compared to WHO limit of 50 mg/l in surface waters ( Fig. 6 ). The mean concentration of Ca, Mg , Na and K were 15.21 mg/l, 885.5 mg/l, 1580 mg/l , and 294.7 mg/l during the dry season and 13.97 mg/l , 612.7 mg/l , 824.5 mg/l and 178.1 mg/l during the dry season (Table 6 ). The values for Ca, Mg and K , were higher than the WHO limit of 250 mg/l. The high values of magnesium and sodium could be attributed to contributions from the saline water from the Atlantic ocean. High sodium content in water causes active corrosion on metal substrates ( Egereonu et al, 2012 ). The concentrations of sulphate, nitrate, nitrite, chloride and ammonium ions in the water were 255.9 mg/l, 2.50 mg/l, 0.18 mg/l , 441.1 mg/l , 0.11 mg/l respectively during the dry season and 184.3 mg/l, 1.91 mg/l , 0.42 mg/l , 410.3 mg/l , 0.17 mg/l respectively during the wet season. Sulphate was higher than WHO limit of 250 mg/l during the dry season , while chloride was higher than WHO limit of 250 mg/l in both seasons ( Table 6 ). The high chloride concentration in both seasons could be attributed to influence of saline water from the Atlantic ocean, with high salinity value. Based on the physicochemical parameters of the water, the pollution index determined for the wet season gave a value of 0.97, which is less than a value of 1 for an unpolluted surface water body, but gave a pollution index of 1.34 during the dry season ( Table 6). The polluted index of the water for dry season was more than 1 for an unpolluted surface water body. However, the lower polluted index for wet season could be attributed to dilution from the surface runoff. The particle size distribution of the sediments of Iko River gave 78.22 % sand , 9.45 % clay and 12.32 % silt during the dry season , while the results gave 74.36 % sand, 10.46 % clay and 15.13 % silt during the wet season ( Fig.11 and Table 7 ). The predominance of sand in the sediments is in agreement with the observation by Ekwere et al . ( 1992 ), that in the sediments of the Bight of Bonny , which is in the eastern flank of the Niger Delta, sand and sandy silt are predominant by the classification of Folk ( 1974 ). They observed that the strong tides and long shore drift tend to influence the distribution pattern of the sediment fractions. The low content of clayey materials which are known to be good scavengers for metallic and organic contaminants indicates that Iko River sediments are not likely to be important sinks for metallic pollutants entering the water body. This implies that the absence of a sediment sink ( low clay ) will enhance the pollutants remaining mostly in suspension or in solution in the river. And of course, increasing the lifetime of the pollutants in the water column obviously increases their accessibility to the biota. The total organic carbon content of the sediments in both seasons were higher than an optimum value of 1.3 % , indicating a relatively high content of organic matter in the sediments. This may be due to the diversified sources of organic matter in Iko River sediments , which are marine sediments and could have been derived from decomposition of marine organisms , terrestrial inputs from surface discharge and oil spillages from bunkering
- 4. Journal of Environment and Earth Science www.iiste.org ISSN 2224-3216 (Paper) ISSN 2225-0948 (Online) Vol. 3, No.8, 2013 99 activities ( Demaison and More, 1980 ). The mean total hydrocarbon content of the water from Iko River was 44.12 mg/l during the dry season and 35.59 mg/l during the wet season . The values were lower than a natural background value of 50 mg/l set by the WHO ( Table 6 ) . The mean total hydrocarbon content of the sediments was 377.5 mg/kg during the dry season and 288.7 mg/kg during the wet season ( Table 2 ). The values for both seasons were far above 200 mg/kg total hydrocarbon concentration set for moderately polluted areas in the bottom sediments of Arabian Gulf ( Massoud et al. 1996 ). In comparison to this study, the natural background levels of total hydrocarbon in bottom sediments of the Arabian Gulf were found to be 10 to 50 mg/kg and the concentration above this level was attributed to inputs from anthropogenic sources such as oil spills , oil slicks and seepage ( Literathy et al , 1989 ) . 5. Conclusion In both seasons, the higher conductivity for water and sediments is attributed to salt water intrusion from the Atlantic Ocean, indicating that geochemical reactions which occur in the sediments and water column are largely influenced by the physico-chemical conditions in the sediment-water complex, in particular conductivity and redox potential. Based on the average total hydrocarbon content of the sediments, Iko River sediments could be said to be heavily polluted , while the average total hydrocarbon of the water is still within acceptable limit. The concentrations of the hydrocarbons obtained are close to those reported by other workers on marine sediments in Kuwait and Saudi Arabia ( Literathy et al 1989; Michel et al, 1993 ). From the results obtained in this study, it was established that there were seasonal and locational variations in the mean levels of the physic-chemical parameters of the water and sediments of Iko River. The p H values of the water were within the recommended WHO limits for unpolluted streams and rivers ( WHO, 1984 ; Prati et al, 1974 ). However, the principal cations in the river namely, calcium , sodium, magnesium and potassium were of high levels , far in excess of the WHO limits set for drinking waters and natural waters ( WHO, 1984 ). The high levels of these cations point to the fact that Iko River is particularly vulnerable to the inputs of chemical pollutants. The unique chemistry suggests that the ecology of the river is very fragile and a slight shift in composition can potentially be disastrous to some component of the food chain. The mean levels of salinity and salt content of the water indicate that the river water is brackish and there is much influence of saline water over runoff water from the coastline. Results from the grain-size distribution revealed that the sediments from the river predominantly consisted of sand and less of silt and clay. This implies that the sediments of Iko River are not likely to be important sinks for chemical pollutants, thus making pollutants available to biota in the water column. References Ansa , O. A ( 1998) . Industries and Community Development .- An Appraisal . A paper presented at the International Workshop on Industrial Pollution Management for sustainable community development. Uyo, Akwa Ibom State, Nigeria. APHA, AWWA, WPCF ( 2005 ) . Standard Methods for the Examination of Water and Wastewater . 21st Edition . Washington DC. Demaison , G. J. and Moore, G. T. ( 1980 ). Anoxic Environments and Oil Source bed genesis. Amer. Asso. Petrol. Geol. Bulletin. 64.1179 – 1209. Edet, A. E. and Ntekim, E.U. ( 1996 ). Heavy metal distribution in ground waterfrom Akwa Ibom State , Eastern Niger Delta, Nigeria.- A preliminary pollution assessment . Global Journal of Pure and Applied Science . 2 ( 1 ), 67 – 77. Egereonu, U. U; Anuo, A.U. and Egereonu, J.C.( 2012). Comparative analysis of the degree of pollution of Okitankwo River along border communities :Mbaitoli, Ikeduru, Emekuku and Uratta of Imo State, Nigeria. Analytical Science Journal . 1( 1), 7 – 16. Ekpe, U.J.; Ekanem U. and Akpan, E. R.( 1995 ). Temporal changes in some water quality parameters in Iko and Uta Ewa Rivers, South eastern Nigeria. Global Journal of Pure and Applied Science.1. 63 – 68. Ekwere, S. J; Ntekim, E. E. and Okon , G. A ( 1992 ) . Trace metal distribution in the sediments of the Bight of Bonny , South Eastern Nigeria. Tropical Journal of Applied Sciences. 2. 8 – 14. Enemugwem, J. H. (2009 ). Oil Pollution and Eastern Obolo Human Ecology, 1957 – 2007 . International Multidisciplinary Journal . Vol. 3, 1, 136 – 151. Enyenihi, U. K; Adeyemi –Wilson, O.A. and Obiekezie , A. I. ( 1987 ). Ecological parameters of the mangrove swamp forests of Cross River State Baseline study. In proceedings of the International Seminar on Petroleum Industry and Nigeria Environment. Owerri, Nigeria. 228 – 239. Fimsco Resources Field Surveys (2002 ). Social Impact Assessment of Utakpete /Opobo South Fields. Port Harcourt : FimscoResources , 2002 .P. vii.
- 5. Journal of Environment and Earth Science www.iiste.org ISSN 2224-3216 (Paper) ISSN 2225-0948 (Online) Vol. 3, No.8, 2013 100 Folk, R. L (1994 ) Coastal baseline studies of pollutants in Bahrain , United Arab Emirate and Oman. Proceedings of Symposium on Regional marine monitoring and research programmes Al-Ain, A.E. 155 – 180. IITA ( 1979 ) . Selected methods of soil and plant analysis manual . Series No. 1, Ibadan, Nigeria. Imevbore, A. M. ( 1970 ). The chemistry of River Niger in Kanji Lake Reservoir Area. Arch. Hydrobiol. 67, 412 – 431. Intergovernmental Oceanographic Commission (1982 ) . The determination of petroleum hydrocarbons in sediments . UNESCO manuals and guides, II . Litherathy, P; Jacob, P. G. ; Al-bloushi, A. and Zarba, M. ( 1989 ). Screening of pollutants in the coastal marine environment of Kuwait . EES-123. Final Report KISR2900 Kuwait Institute for Scientific Research , Kuwait. Loring, D.H. and Rantala, R.T. ( 1992) . Manual for the geochemical analysis of marine sediments and suspended particulate matter . Earth Science Reviews. 32, 235 – 283. Massoud, M. S; Al-Abdali, F; Al-Ghadan, A.N. and Al-Sarawi, M. ( 1996 ). Bottom sediments of the Arabian Gulf-II. Total petroleum hydrocarbon and total organic carbon contents as indicators of oil pollution and implications for the effect and fate of the Kuwait oil slick. Environ. Pollution .93, 271 – 284. Michel , J; Hayes, M. O; Keenan,R.S.; Sauer, T.C; Jensen,J.R and Narumalani, S. (1993) . Contaminationof near shore sub tidal sedimentsof Saudi Arabia from the Gulf war oil spill. Marine Biology. 27, 109 – 116. Mobil ( 1997 ) . Environmental Impact Assessment of Yoho Field Development Project. Lagos . NNPC- Mobil Publications, 1997, 39. Moses, B. S. ( 1979). The Cross River, Nigeria- its ecology and fisheries . In proceedings of the International Conference on Kanji Lake and River Basin Development in Africa. Kanji Lake Research Institute , New Bussa, Nigeria. 335 – 370. Prati, L.; Pavenello, R. and Rearing , P.(1974) . Assessment of water quality by a single index of pollution . Water Resources . 5, 74 – 81. Regional Organisation for the Protection of Marine Environment ( ROMPE). (1983).Manual of oceanographic observations and pollutant analysis methods. Regional Organisation for the protection of marine environment. Kuwait . Rump, H. H. and Krist, H.(1988). Laboratory Manual for the Examination of Water, Waste water and Soil . (Ed. Dt. Ges. Fur.Tech. Zusammanarbeit (GTZ). GMBH Weinheim; Bassel , Cabridge; New York, VCH. The World Bank ( 1995). Defining an Environmental Development Strategy for the Niger Delta. Vol. 1, 150. Uzoukwu, B.A. ; Eze ,C. F. and Ordu, P. O. ( 2005 ). Physicochemical profile study of a portion of the Ulasi River from Ezinifite to Ogwu- Aniocha , in Anabra State of Nigeria. Global Journal of Pure and Applied Sciences . 11 ( 4) , 517 – 521. W.H.O. ( 1984 ). Guide lines for drinking water quality . Volume 2. Health Criteria and other supporting information . WHO, Geneva. 85 – 315. Water Quality International –WQI. ( 1991). The Newsmagazine of the international association of London. United Kingdom. 3, 37.
- 6. Journal of Environment and Earth Science www.iiste.org ISSN 2224-3216 (Paper) ISSN 2225-0948 (Online) Vol. 3, No.8, 2013 101 Table 1 : Mean Monthly Variation in Physicochemical Parameters in Water from Iko River Parameter Nov.20 11 Dec. 2011 Jan. 2012 Feb. 2012 June .2012 July. 2012 Aug. 2012 Sept. 2012 Temp. o C 24.8 24.6 24.9 23.7 23.5 23.9 24.8 24.1 Conductivity ( m S/cm ) 66.9 72.2 82.1 83.6 67.6 60.9 55.8 45.7 p H 6.76 6.82 6.63 6.53 6.88 6.91 6.8 5.87 DO ( mg/l ) 7.8 7.7 8.42 7.81 6.31 7.11 5.6 7.21 BOD5 ( mg/l ) 2.75 3.2 3.42 3.05 3.57 3.18 3.74 4.17 COD ( mg/l) 5.41 5.26 5.65 6.09 5.03 5.29 5.11 6.43 Total Hydrocarbon ( mg/l) 49.2 44.06 39.34 43.89 38.39 36.43 34.63 40.91 Ca ( mg/l ) 10.99 14.42 17.69 17.74 15.79 13.28 14.08 12.83 Mg ( mg/l) 768.3 857.4 981.4 934.9 683.4 590.2 624.3 553.1 Na ( mg/l) 1796 1588 1573 1363 928 797.9 839.2 732.9 K (mg/l) 305.5 311.5 279.8 282.1 189.9 193.1 185.2 144 Acidity ( mg/l) 2.69 2.58 2.85 2.58 2.61 1.89 2.04 1.88 Sulphate ( mg/l) 270.3 270.6 243.4 239.5 208.3 183.7 174.5 170.8 Nitrate ( mg/l ) 2.41 2.62 2.78 2.24 2.26 1.85 1.86 1.68 Nitrite ( mg/l) 0.11 0.19 0.26 0.17 0.22 0.38 0.47 0.62 Chloride ( mg/l) 428.2 435.7 471.4 429.4 459.7 412.8 376.3 392.2 Ammonium ( mg/l ) 0.07 0.09 0.16 0.11 0.14 0.17 0.19 0.19 Salinity ( %o ) 0.77 0.79 0.85 0.78 0.83 0.74 0.68 0.71
- 7. Journal of Environment and Earth Science www.iiste.org ISSN 2224-3216 (Paper) ISSN 2225-0948 (Online) Vol. 3, No.8, 2013 102 Table 2 : Mean Monthly Variation in Physicochemical Parameters in Sediment from Iko River Parameter Nov.2011 Dec. 2011 Jan. 2012 Feb. 2012 June .2012 July. 2012 Aug. 2012 Sept. 2012 Conductivity ( m S/cm) 15.06 13.72 13.08 12.76 11.85 12.14 11.4 11.82 p H 5.41 5.75 5.96 6.27 6.62 6.61 6.7 6.74 TOC ( % ) 1.71 1.68 1.55 1.59 1.54 1.52 1.58 1.37 Total Nitrogen ( % ) 0.28 0.32 0.37 0.43 0.39 0.45 0.41 0.39 Available P. ( mg/kg) 2.75 2.18 1.89 1.86 1.66 1.61 1.43 1.46 Total Hydrocarbon ( mg/kg) 403.7 396.3 351.5 358.3 308.2 290.9 274.5 281.5 Ca ( meq/100 g ) 9.38 9.31 7.98 7.01 4.52 3.59 3.21 2.85 Mg ( meq/100 g) 7.78 6.46 5.01 4.91 4.59 4.04 3.18 2.63 Na ( meq/100 g) 0.52 0.54 0.52 0.46 0.51 0.56 0.45 0.41 K (meq/100 g) 0.34 0.36 0.37 0.35 0.44 0.41 0.39 0.33 EA ( meq/100 g ) 1.81 1.56 1.53 1.58 1.66 1.47 1.52 1.42 ECEC (meq/100 g ) 19.82 18.23 15.41 14.97 11.72 10.06 8.72 7.64 Base Saturation ( % ) 90.26 91.27 89.97 88.77 84.63 84.12 81.33 80.54 Total Carbon ( % ) 3.84 3.49 3.43 3.51 3.21 2.98 3.12 3.42 Sulphur ( % ) 1.46 1.27 1.21 1.23 1.21 1.13 1.19 1.27
- 8. Journal of Environment and Earth Science www.iiste.org ISSN 2224-3216 (Paper) ISSN 2225-0948 (Online) Vol. 3, No.8, 2013 103 Table 3: Mean, Range and Standard Deviation of Physicochemical Parameters in water samples from Iko River during Dry/wet Seasons Parameter Dry Season Wet Season Mean Range Std. dev. Mean Range Std. dev. Temp. o C 24.5 23.7 - 24.9 0.55 24.08 23.5 - 24.8 0.54 Conductivity ( m S/cm ) 76.2 66.9 - 83.6 8 57.5 45.7 - 67.6 9.23 p H 6.69 6.53 - 6.82 0.13 6.62 5.87 - 6.91 0.50 DO ( mg/l ) 7.93 7.7 - 8.42 0.33 6.01 5.00 - 7.1 0.91 BOD5 ( mg/l ) 3.11 2.75 - 3.42 0.28 3.39 3.07 - 3.74 0.32 COD ( mg/l) 5.35 5.09 - 5.65 0.24 5.31 5.03 - 5.80 0.35 Total Hydrocarbon ( mg/l) 44.12 39.34 - 49.20 4.03 35.59 32.90 - 38.39 2.36 Ca ( mg/l ) 15.21 10.99 - 17.74 3.21 13.97 12.72 - 15.79 1.34 Mg ( mg/l) 885.5 768.3 - 981.4 93.39 612.7 553.1 - 683.4 55.39 Na ( mg/l) 1580 1363 - 1800 176.7 824.5 732.9 -928.1 81.7 K (mg/l) 294.7 279.8 - 311.5 16.12 178.1 144.1 - 193.0 22.93 Acidity ( mg/l) 2.68 2.58 - 2.85 0.13 2.11 1.88 - 2.61 0.34 Sulphate ( mg/l) 255.9 239.5 - 270.6 16.82 184.3 174.5 - 208.0 16.74 Nitrate ( mg/l ) 2.5 2.20 - 2.78 0.25 1.91 1.68 - 2.26 0.25 Nitrite ( mg/l) 0.18 0.11 - 0.26 0.06 0.42 0.22 - 0.62 0.17 Chloride ( mg/l) 441.1 428.1 - 471.4 20.46 410.3 376.3 - 459.7 36.19 Ammonium ( mg/l ) 0.11 0.07 - 0.16 0.04 0.17 0.14 - 0.19 0.02 Salinity ( %o ) 0.8 0.77 - 0.85 0.04 0.74 0.68 - 0.83 0.07 Table 4: Mean, Range and Standard Deviation of Physicochemical Parameters in sediments from Iko River during Dry/wet Seasons Parameter Dry Season Wet Season Mean Range Std. dev. Mean Range Std. dev. p H 5.85 5.41 - 6.27 0.36 6.67 6.61 - 6.74 0.06 Conductivity ( m S/cm ) 13.66 12.76 -15.06 1.02 11.8 11.40 - 12.14 0.3 TOC ( % ) 1.63 1.55 - 1.71 0.08 1.56 1.52 - 1.58 0.03 Total Nitrogen ( % ) 0.35 0.28 - 0.43 0.06 0.41 0.39 - 0.45 0.03 P- Phosphate ( mg/kg ) 2.17 1.86 - 2.75 0.41 1.54 1.43 - 1.66 0.11 Ca (meq/100 g ) 8.42 7.01 - 9.38 1.14 3.54 2.85 - 4.52 0.72 Mg ( meq/100 g ) 6.04 4.91 - 7.78 1.36 3.61 2.63 - 4.59 0.87 Na ( meq/100 g ) 0.51 0.46 - 0.54 0.03 0.48 0.41 - 0.56 0.07 K (meq/100 g ) 0.36 0.34 - 0.37 0.01 0.39 0.33 - 0.44 0.05 E A (meq/100 g ) 1.62 1.53 - 1.81 0.13 1.51 1.42 - 1.66 0.1 ECEC (meq/100 g ) 17.06 14.79 - 19.82 2.37 9.54 7.64 - 11.72 1.76 Base saturation ( % ) 90.07 88.77 - 91.27 1.03 82.66 80.54 - 84.63 2.02 THC (mg/kg ) 377.5 351.5 - 403.7 26.36 288.7 274.5 - 308.2 14.59 Total carbon ( % ) 3.48 3.43 - 3.51 0.03 3.18 2.98 - 3.42 0.18 Sulphur ( % ) 1.29 1.21 - 1.46 0.11 1.20 1.13 - 1.27 0.06
- 9. Journal of Environment and Earth Science www.iiste.org ISSN 2224-3216 (Paper) ISSN 2225-0948 (Online) Vol. 3, No.8, 2013 104 Table 5: Mean Monthly Variation of exchangeable cations in sediment from Iko River Parameter Nov.20 11 Dec. 2011 Jan. 2012 Feb. 2012 June .2012 July. 2012 Aug. 2012 Sept. 2012 Ca ( meq/100 g ) 9.38 9.31 7.98 7.01 4.52 3.59 3.21 2.85 Mg ( meq/100 g) 7.78 6.46 5.01 4.91 4.59 4.04 3.18 2.63 Na ( meq/100 g) 0.52 0.54 0.52 0.46 0.51 0.56 0.45 0.41 K (meq/100 g) 0.34 0.36 0.37 0.35 0.44 0.41 0.39 0.33 EA ( meq/100 g ) 1.81 1.56 1.53 1.58 1.66 1.47 1.52 1.42 ECEC (meq/100 g ) 19.82 18.23 15.41 14.97 11.72 10.06 8.72 7.64 Table 6 : Pollution index of Iko River water for dry / wet seasons Parameter Dry Season Wet Season Mean WHO Limits Pollution index Mean WHO Limits Pollution index Temp. o C 24.5 25 0.98 24.08 25 0.96 Conductivity ( m S/cm ) 76.2 50 1.52 57.5 50 1.15 p H 6.69 6.5 - 8.5 1.03 6.62 6.5 - 8.5 1.02 DO ( mg/l ) 7.93 5 1.59 6.01 5 1.2 BOD5 ( mg/l ) 3.11 6 0.52 3.39 6 0.57 COD ( mg/l) 5.35 10 0.54 5.31 10 0.53 Total Hydrocarbon ( mg/l) 44.12 50 0.88 35.59 50 0.71 Ca ( mg/l ) 15.21 50 0.31 13.97 50 0.28 Mg ( mg/l) 885.5 250 3.54 612.7 250 2.45 Na ( mg/l) 1580 250 6.32 824.5 250 3.3 K ( mg/l ) 294.7 250 1.18 178.1 250 0.71 Acidity ( mg/l) 2.68 2.11 Sulphate ( mg/l) 255.9 250 1.02 184.3 250 0.74 Nitrate ( mg/l ) 2.5 45 0.06 1.91 45 0.04 Nitrite ( mg/l) 0.18 5 0.04 0.42 5 0.08 Chloride ( mg/l) 441.1 250 1.76 410.3 250 1.64 Ammonium ( mg/l ) 0.11 < 1.0 0.11 0.17 < 1.0 0.17 Salinity ( %o ) 0.8 0.74 Table 7 : Particle Size distribution of sediments from Iko River Particle size Mean for Dry Season Mean for Wet Season Sand ( % ) 78.22 74.36 Clay ( % ) 9.45 10.46 Silt ( % ) 12.32 15.13
- 10. Journal of Environment and Earth Science www.iiste.org ISSN 2224-3216 (Paper) ISSN 2225-0948 (Online) Vol. 3, No.8, 2013 105 Fig . 2 : Mean monthly Acidity and Exchangeable cations in water from Iko River Fig. 3 : Mean monthly variation of salinity, nutrients, p H , DO, BOD5 and COD in water Fig. 4 : Mean monthly Total N, Cond., p H , TOC , Avail. P in sediments from Iko River.
- 11. Journal of Environment and Earth Science www.iiste.org ISSN 2224-3216 (Paper) ISSN 2225-0948 (Online) Vol. 3, No.8, 2013 106 Fig. 11 : Particle size distribution of Iko River for Dry/Wet Seasons Fig. 5 : Mean monthly variation of exchangeable cations, exchangeable acidity and ECEC in sediment from Iko River
- 12. Journal of Environment and Earth Science www.iiste.org ISSN 2224-3216 (Paper) ISSN 2225-0948 (Online) Vol. 3, No.8, 2013 107 Fig. 6 : Mean monthly THC in water and sediment from Iko River Fig. 7 : Mean monthly variation of Base saturation, Total carbon and sulphur in sediments from Iko River
- 13. Journal of Environment and Earth Science www.iiste.org ISSN 2224-3216 (Paper) ISSN 2225-0948 (Online) Vol. 3, No.8, 2013 108 Fig. 8 : Mean monthly Physicochemical parameters in water from Iko River during dry /wet seasons
- 14. Journal of Environment and Earth Science www.iiste.org ISSN 2224-3216 (Paper) ISSN 2225-0948 (Online) Vol. 3, No.8, 2013 109 Fig. 9 : Mean monthly Mg, Na, K, Cl, Sulphate, Cond. Of water from Iko River during the dry/wet seasons Fig.10 : Mean Physicochemical parameters in sediment from Iko River during 0 200 400 600 800 1000 1200 1400 1600 1800 Dry Season Wet season
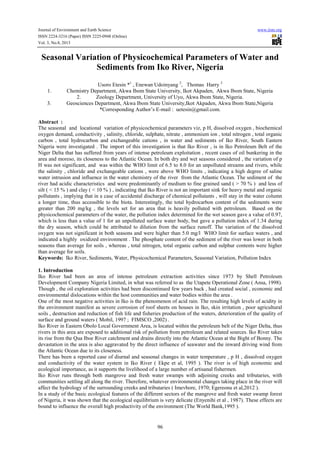
- 15. Journal of Environment and Earth Science www.iiste.org ISSN 2224-3216 (Paper) ISSN 2225-0948 (Online) Vol. 3, No.8, 2013 110 40 27 40 37 40 47 Ikot Ibritam Ikot Nung Ikot Akpan Udo Ette Ikot AbasiOpobo Okoro Inyang Obianga Mkpat Enin Ikot Akpaden Okoro Ette Iko Efa Ikot Ndiya Ikot Ekpan EketAseno Ibofo Abat 2 1 3 4 5 6 BIGHT OP BONNY RIVERS STATE 70 25’7E ’23N ’23N ’23N 40 27’23N 40 37’23N 40 47’23N 70 25’7E 70 35’7E 70 45’7E 0 0 0 Sand,Clay,Swamp Alluvium,Swamp Geologic boundary Fault(from aero survey) Town Rivers Sample locations Roads Legend NIGERIA AkwaIbomState 7 35’7E 7 45’7E 7 ’7E 0 1 0 Scale: 1:250,000 55 0 7 ’7E55 Fig.1: Map of the study area showing Sample locations
- 16. This academic article was published by The International Institute for Science, Technology and Education (IISTE). The IISTE is a pioneer in the Open Access Publishing service based in the U.S. and Europe. The aim of the institute is Accelerating Global Knowledge Sharing. More information about the publisher can be found in the IISTE’s homepage: http://www.iiste.org CALL FOR PAPERS The IISTE is currently hosting more than 30 peer-reviewed academic journals and collaborating with academic institutions around the world. There’s no deadline for submission. Prospective authors of IISTE journals can find the submission instruction on the following page: http://www.iiste.org/Journals/ The IISTE editorial team promises to the review and publish all the qualified submissions in a fast manner. All the journals articles are available online to the readers all over the world without financial, legal, or technical barriers other than those inseparable from gaining access to the internet itself. Printed version of the journals is also available upon request of readers and authors. IISTE Knowledge Sharing Partners EBSCO, Index Copernicus, Ulrich's Periodicals Directory, JournalTOCS, PKP Open Archives Harvester, Bielefeld Academic Search Engine, Elektronische Zeitschriftenbibliothek EZB, Open J-Gate, OCLC WorldCat, Universe Digtial Library , NewJour, Google Scholar