Weekly Projects Update - w/e 12th May
•
0 likes•915 views

AcuComm's weekly projects update - w/e 12th May. For more information on our latest projects, head here.. http://goo.gl/ItKV3Z

Recommended
Recommended
More Related Content
More from AcuComm
More from AcuComm (20)
Recently uploaded
Recently uploaded (20)
Weekly Projects Update - w/e 12th May
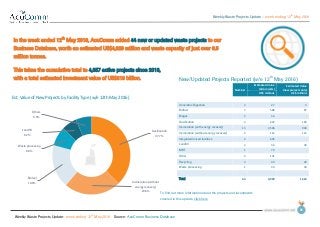
- 1. Weekly Waste Projects Update – week ending 12 th May 2016 Weekly Waste Projects Update: week ending 12 th May 2016 Source: AcuComm Business Database 01 New/Updated Projects Reported (w/e 12th May 2016) Number Estimated Value (all projects) Estimated Value (new projects only) US$ millionsUS$ millions Anaerobic Digestion 3 27 3 Biofuel 3 588 87 Biogas 2 56 - Gasification 3 607 183 Incineration (with energy recovery) 15 2,506 938 Incineration (without energy recovery) 3 115 115 Integrated/mixed facilities 2 695 - Landfill 3 36 30 MBT 1 70 - Other 4 141 - Recycling 4 49 29 Waste processing 1 39 39 Total 44 4,929 1,424 In the week ended 12th May 2016, AcuComm added 44 new or updated waste projects to our Business Database, worth an estimated US$4,929 million and waste capacity of just over 6.5 million tonnes. This takes the cumulative total to 4,057 active projects since 2013, with a total estimated investment value of US$310 billion. Gasification 37.7% Incineration (without energy recovery) 23.6% Biofuel 18.0% Waste processing 8.0% Landfill 6.2% Others 6.5% Est. Value of New Projects by Facility Type (w/e 12th May 2016) To find out more information about the projects and investments covered in this update, click here
- 2. Weekly Waste Projects Update – week ending 12 th May 2016 Weekly Waste Projects Update: week ending 12 th May 2016 Source: AcuComm Business Database 02 New/Updated Projects Reported (w/e 12th May 2016) Number Capacity (tonnes) MW Anaerobic Digestion 3 163,604 5 Biofuel 3 623,437 9 Biogas 2 23,193 8 Gasification 3 558,199 44 Incineration (with energy recovery) 15 3,078,523 770 Incineration (without energy recovery) 3 249,803 - Integrated/mixed facilities 2 440,000 47 Landfill 3 430,253 8 MBT 1 120,000 6 Other 4 444,694 68 Recycling 4 358,210 - Waste processing 1 18,250 - Total 44 6,508,166 966 The total estimated waste capacity of projects reported on in the past week is just over 6.5 million tonnes. WtE incineration was the largest category, accounting for just over 2.5 million tonnes. The total estimated power generation from these projects was 966 MW. WtE incineration was the largest category, accounting for 770 MW. Incineration (with energy recovery) 47.3% Biofuel 9.6% Gasification 8.6% Others 34.5% Reported Capacity of Projects by Facility Type (w/e 12th May 2016) To find out more information about the projects and investments covered in this update, click here
- 3. Weekly Waste Projects Update – week ending 12 th May 2016 Weekly Waste Projects Update: week ending 12 th May 2016 Source: AcuComm Business Database 03 New Projects Reported by Waste Types (w/e 12th May 2016) Number Capacity (tonnes) MW Animal 1 50,000 1 Clinical 1 803 - Construction/Demolition - - - e-Waste - - - Food - - - Gas 3 - 76 Glass 1 124,518 - Hazardous 2 414,694 - Heat - - - Industrial 1 129,363 10 Metals - - - MSW 18 3,613,786 303 Oil - - - Organic (general/unspecified) 2 338,887 5 Other - - - Paper - - - Plant biomass (non-waste) - - - Plant biomass (waste) 2 126,717 4 Plastics 1 29,504 - Radioactive - - - Rubber 1 37,437 - Sewage/wastewater 3 242,193 8 Wood 8 1,400,265 559 Total 44 6,508,166 966 Municipal Solid Waste and wood were the leading feedstocks in the past week, accounting for 3.6 million tonnes and 1.4 million tonnes respectively. MSW 55.5% Wood 21.5% Hazardous 6.4% Others 16.6% Reported Capacity of Projects by Waste Type (w/e 12th May 2016) To find out more information about the projects and investments covered in this update, click here
- 4. Weekly Waste Projects Update – week ending 12 th May 2016 Weekly Waste Projects Update: week ending 12 th May 2016 Source: AcuComm Business Database 04 New/Updated Projects, Country Coverage, (w/e 12th May 2016) Projects UK 10 USA 9 China 3 Thailand 2 Canada 2 Australia 2 Others 16 Total 44 The leading countries in the past week were the UK with ten projects, and the USA with nine. 10 9 3 2 2 2 0 0 0 0 0 16 0 2 4 6 8 10 12 14 16 18 UK USA China Thailand Canada Australia Others Reported Projects by Country (w/e 12th May 2016) To find out more information about the projects and investments covered in this update, click here
- 5. Weekly Waste Projects Update – week ending 12 th May 2016 Weekly Waste Projects Update: week ending 12 th May 2016 Source: AcuComm Business Database 05 Average Project Values by Facility Type US$ millions Anaerobic Digestion 23 Biofuel 123 Biogas 27 Gasification 155 Incineration (with energy recovery) 109 Incineration (without energy recovery) 62 Integrated/mixed facilities 182 Landfill 22 MBT 67 Other 112 Recycling 27 Waste processing 65 All Projects 76 Average Project Values by Feedstock Type US$ millions Animal 17 Clinical 30 Construction/Demolition 9 e-Waste 26 Food 18 Gas 48 Glass 12 Hazardous 79 Heat 25 Industrial 96 Metals 51 MSW 92 Oil 42 Organic (general/unspecified) 90 Other 67 Paper 84 Plant biomass (non-waste) 115 Plant biomass (waste) 80 Plastics 22 Radioactive 564 Rubber 33 Sewage/wastewater 42 Wood 86 All Projects 76 The average active waste project is worth US$76 million. There are naturally wide variations in average project value, due to the size, duration and complexity of different types of project. The figures on this page represent our latest estimates, based on data from 2013 to the current week. To find out more information about the projects and investments covered in this update, click here
- 6. Weekly Waste Projects Update – week ending 12 th May 2016 Weekly Waste Projects Update: week ending 12 th May 2016 Source: AcuComm Business Database 06 Top Five Projects, week ending 12th May 2016, by Estimated Value (US$ millions) Click the flag for more information on each project 1 Sweden 624 Construction of a new biomass-fuelled combined heat and power plant. 2 UK 509 Construction of a >250,000 tonne capacity WtE facility. 3 Australia 349 WtE plant fuelled by MSW and commercial & industrial waste. 4 UK 319 Development of an energy recovery facility. 5 Brazil 267 Construction of a 50 MW biomass plant. Top Five Projects, week ending 12th May 2016, by Reported Waste Capacity (tonnes) 1 UK 400,000 Construction of a >250,000 tonne capacity WtE facility. 2 Australia 400,000 WtE plant fuelled by MSW and commercial & industrial waste. 3 Mexico 292,000 Construction of a 3.5 million litres per year waste-to-biodiesel facility planned. 4 China 292,000 Construction of an 800 tpd WtE facility. 5 Ireland 240,000 Development of a resource recovery centre/WtE facility. Top Five Projects, week ending 12th May 2016, by Reported Power Generation (MW) 1 Sweden 410 Construction of a new biomass-fuelled combined heat and power plant. 2 Brazil 50 Construction of a 50 MW biomass plant. 3 Spain 50 Construction of a wood pellet plant and 49.5 MW biomass facility. 4 Australia 35 WtE plant fuelled by MSW and commercial & industrial waste. 5 UK 29 Construction of a >250,000 tonne capacity WtE facility.
- 7. Weekly Waste Projects Update – week ending 12 th May 2016 Weekly Waste Projects Update: week ending 12 th May 2016 Source: AcuComm Business Database 07